
albert Chan
US Retail Sales: August 2021
Coresight Research’s measure of core retail sales is the unadjusted year-over-year change, excluding gasoline and automobiles. This metric strengthened to a strong 12.0% in August, from 8.9% (revised value) in July, as reported by the US Census Bureau on September 16, 2021.
The uptick in August’s growth demonstrates consumers’ continued willingness to spend amid rising Covid-19 Delta cases. This may be partly attributed to historically high levels of savings, supported by previous stimulus payments, and continued wage growth. Overall demand for goods remains strong as the rise in Covid-19 cases redirects some consumer spending away from services (such as dining out and traveling) and toward retail categories.
The acceleration in growth also likely reflects a strong back-to-school (BTS) season against weak BTS demand one year earlier; Coresight Research survey data confirm that August is the peak month for BTS purchases.
Figure 1. US Total Retail Sales ex. Gasoline and Automobiles: YoY % Change
[caption id="attachment_132772" align="aligncenter" width="700"]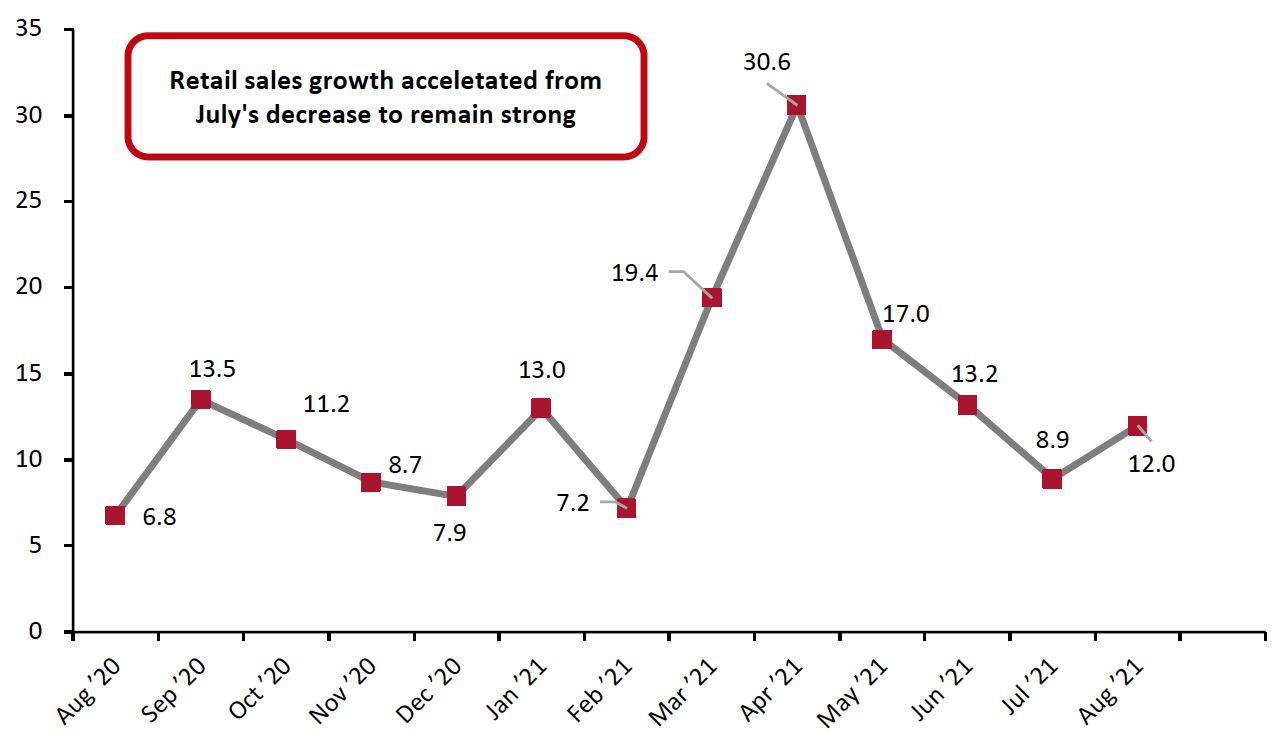 Data are not seasonally adjusted
Source: US Census Bureau/Coresight Research[/caption]
In relation to the more consistent comparatives of 2019, August retail sales were slightly weaker than July’s. August sales grew 19.7% from 2019 values, down 1.1 percentage points from July’s growth. However, on a two-year basis, this was the fifth-strongest growth in sales in the past year (see Figure 2).
Figure 2. US Total Retail Sales ex. Gasoline and Automobiles: % Change from Two Years Prior
[caption id="attachment_132773" align="aligncenter" width="700"]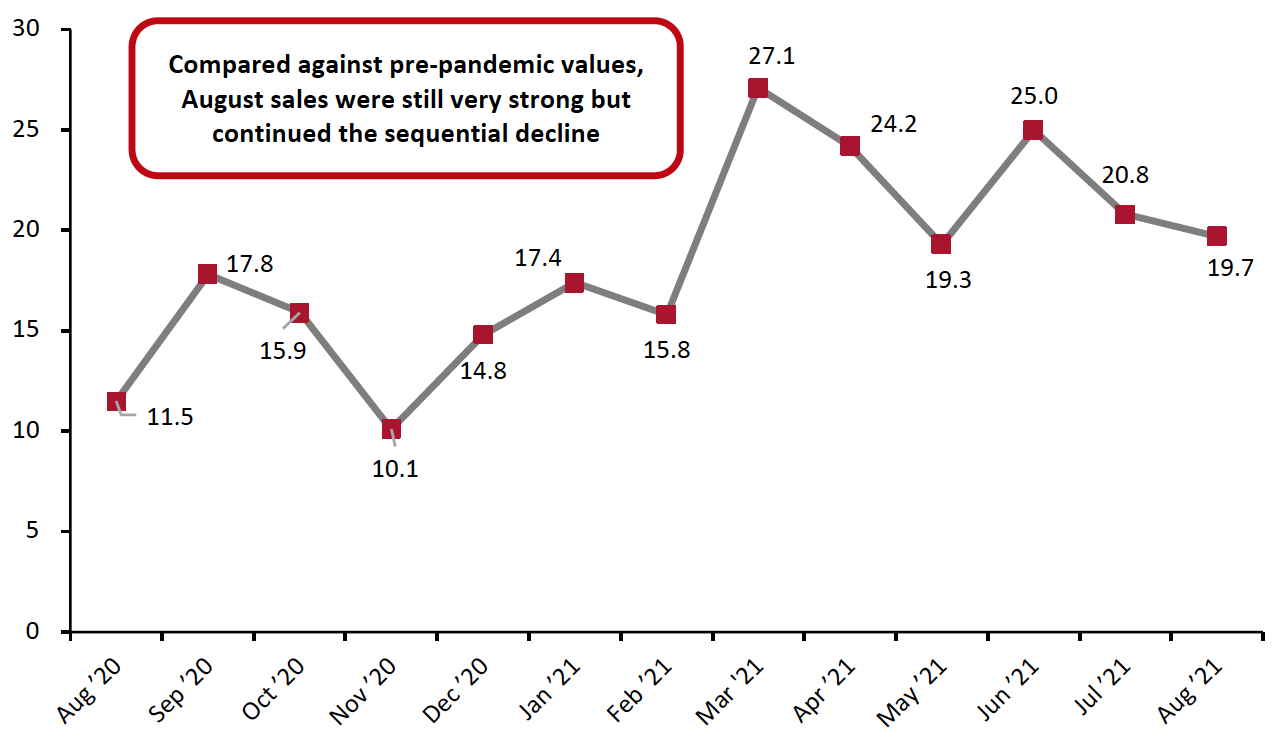 Source: US Census Bureau/Coresight Research[/caption]
Seasonally adjusted retail sales, including automobiles and gasoline, grew 13.1% year over year, versus July’s 12.7% revised growth. In August, the sales of new motor vehicles continued to decline, due in part to global semiconductor shortages.
Figure 3. US Total Retail Sales incl. Gasoline and Automobiles: Seasonally Adjusted YoY % Change
[caption id="attachment_132774" align="aligncenter" width="700"]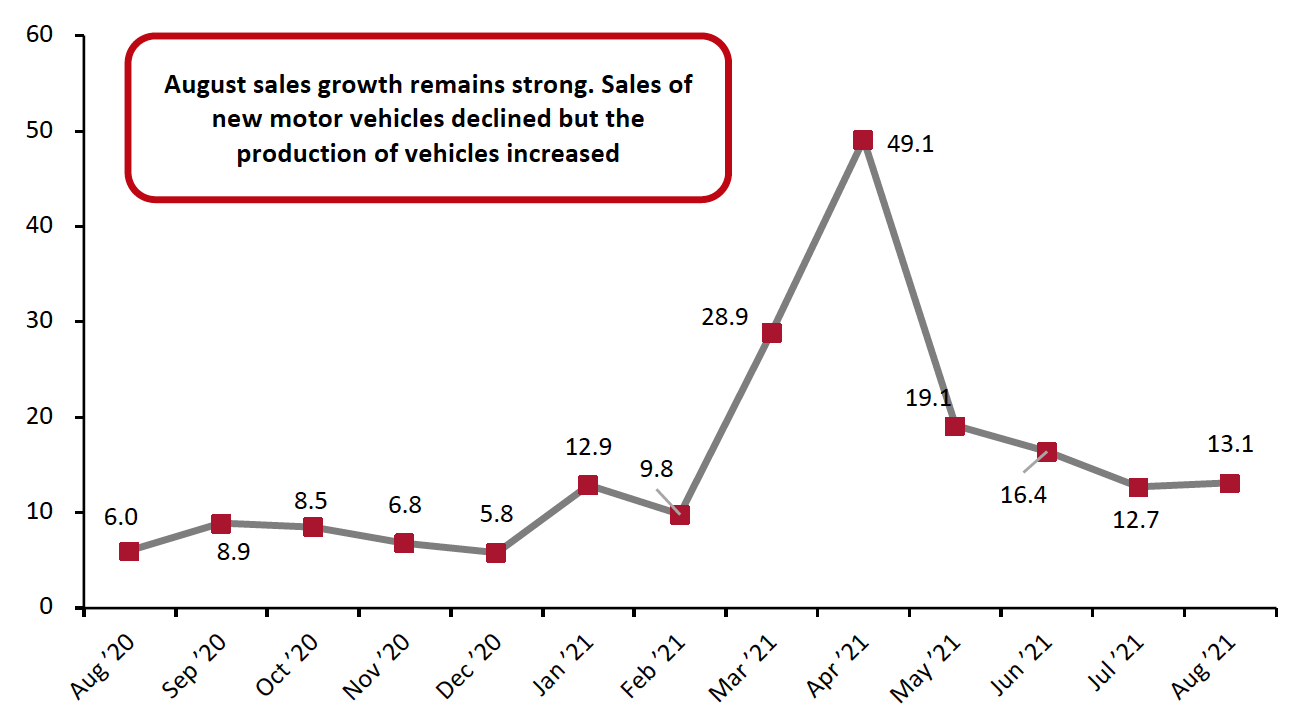 Data are seasonally adjusted
Source: US Census Bureau/Coresight Research[/caption]
Sales Increase Month over Month
On a month-over-month basis, seasonally adjusted sales (excluding automobiles and gas) increased by 2.4% in August, after a 1.9% decrease in July. Despite July’s decrease, the overall trend for sales remains largely positive after a strong August: Sharp spikes in January and March more than compensate for the recent slight declines in April, May and July.
Figure 4. US Total Retail Sales ex. Gasoline and Automobiles: MoM % Change
[caption id="attachment_132775" align="aligncenter" width="700"]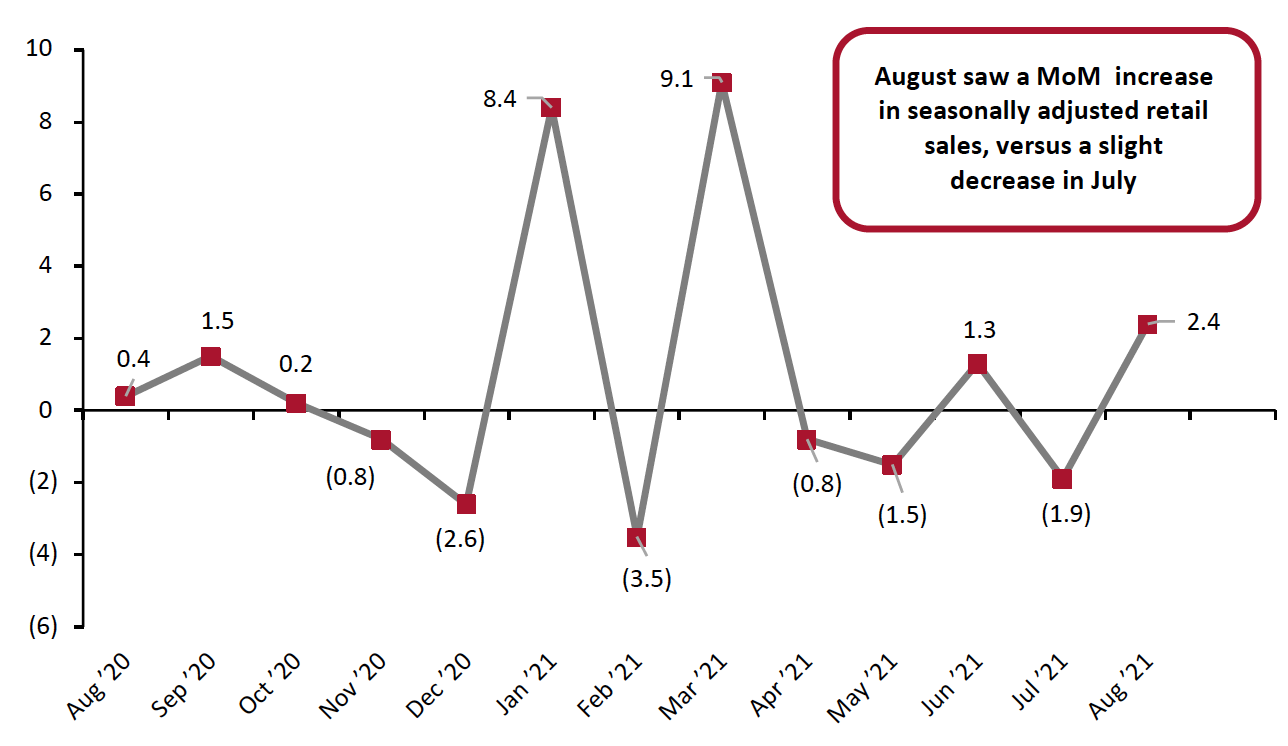 Data are seasonally adjusted
Source: US Census Bureau/Coresight Research[/caption]
Retail Sales Growth by Sector
Although overall retail sales saw double-digit sales growth in August 2020, the spread of Covid-19 through the US last spring hit some sectors much harder than others. To control for the effects of the pandemic in 2020’s retail sales figures, we largely compare August 2021 sales to pre-pandemic August 2019 sales in this section.
In a very strong month, several sectors saw sales growth of around 15% or more from 2019 levels:
- Sporting goods and hobby store sales rose 29.9% from 2019 values. Compared to 2020 values, the sector saw growth of 20.3% year over year.
- Nonstore retailers continued to thrive in August, with sales growing 37.5% from 2019 values. This sector, which includes online-only retailers as well as online sales by some store-based retailers (where e-commerce is considered separate from their stores), saw sales growth of 10.6% from 2020, when many states saw major spikes in infection. The recent increase in Covid-19 cases appears to be sparking a further strengthening of online demand.
- Home-improvement retailers saw growth of 23.2% from pre-pandemic values, keeping sales at the heightened levels we have seen for the past year.
- Furniture and home-furnishings stores—which did not perform nearly as well as home-improvement retailers in 2020—continued their strong performance, recording growth of 20.5% in August 2021 compared to August 2019. This is slightly below the 21.6% growth on a two-year basis seen in July.
- General merchandise stores saw sales growth of 14.5% on a two-year basis. The department stores subsector, which was structurally challenged even before the pandemic hit, saw a robust recovery, with sales growth of 6.3% from 2019 levels.
- Food and beverage stores continued to see elevated sales, rising 13.3% from 2019 levels and 4.8% from 2020 levels. Grocery stores saw 13.3% growth from 2019 and 5.3% growth from 2020. While the year-over-year increases are far lower than in most other sectors, they represent strong performance from the grocery industry following very demanding 2020 comparatives, which have led major grocers to project sales declines in 2021 in the low single digits. Renewed consumer caution is supporting the sector with some switching away from food service to the benefit of food retail.
- Miscellaneous store retailers saw solid sales growth of 20.5% from 2019, a slight deceleration from July’s 28.0% growth.
Some sectors saw more moderate sales increases from 2019 levels, although these were still in double digits:
- Health and personal care store sales grew 12.1% from 2019 values, slightly down from July’s growth of 13.0% from 2019.
- Clothing and clothing accessories stores saw solid sales growth of 8.7% from 2019 levels, down from July’s 18.7% growth from 2019. This supports our expectation of strong recovery in the overall US apparel and footwear market in 2021.
- Electronics and appliance stores saw sales rise 7.3% in August from 2019 values, versus July’s 11.5% growth. Although consumers have spent well on electronics throughout the crisis, for much of 2020 they directed their spending away from specialty electronics retailers to online-focused channels. While sales growth remains solid, the sector’s growth is likely being hampered by the global scarcity of microchips, which are essential for the production of a wide range of electronics and appliances.
Figure 5. US Total Retail Sales, by Sector: YoY % Change from 2020 (Top) and 2019 (Bottom)
[wpdatatable id=1266] [wpdatatable id=1267]Data are not seasonally adjusted Source: US Census Bureau/Coresight Research