Nitheesh NH
US
| What’s New? | Trend Data | Positive or Negative* |
| Earnings vs. Inflation: In the US, seasonally adjusted inflation fell slightly to 5.2% in August, down just 0.1% from July. Inflation remained high, mainly due to increases in the price of gasoline, food and home furniture. Nominal wage growth slightly decelerated to 4.3% in August. Year-over-year growth remains low, mainly due to strong comparatives from July and August 2020—both of which recorded a substantial rise in average weekly earnings owing to huge job losses among lower-paid workers. In August 2021, average hourly earnings rose by $0.19 to $30.73, following an increase of $0.11 in July. Average weekly hours remained at 34.8 for the third straight month. In August, the seasonally adjusted unemployment rate slightly decreased to 5.2%, from July’s 5.4%. Improvements were seen in the professional and business services, manufacturing, and transportation and warehousing sectors. Retail posted a loss of 29,000 jobs in August. In the week ended September 11, 2021, approximately 332,000 Americans filed for unemployment benefits, around 20,000 more than the previous week’s revised level. |
Average Weekly Earnings vs. Consumer Prices: YoY % Change 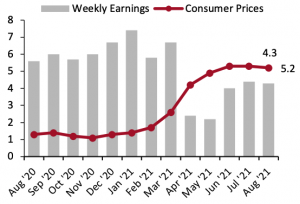 |
|
| Food and Fuel Prices: Food and gas price inflation rates are significant metrics because higher costs in these categories can impact discretionary spending. In August, US food inflation continued to increase for the third straight month. Gasoline price inflation has fluctuated over the last three months but remains very high, caused by a rapid recovery in demand and a tightening of global crude supply by the Organization of the Petroleum Exporting Countries (OPEC). On August 11, the office of US President Joe Biden requested that OPEC and its allies boost crude oil production to mitigate rising gasoline prices. Separately, in July, OPEC and its allies agreed to boost crude oil production by 400,000 barrels per day (bpd), starting in August, until bpd reaches pre-pandemic levels—the oil producers are currently supplying 5.8 million bpd fewer than before the crisis. On September 1, OPEC held a meeting with its allies to reaffirm the 400,000 bpd supply boost. |
Consumer Prices for Food at Home and Gasoline: YoY % Change 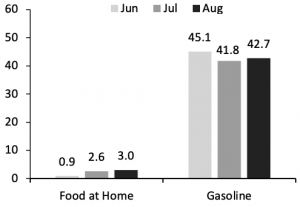 |
|
| Retail Sales: Total US retail sales, excluding gasoline and automobiles, grew by a strong 12.0% year over year and increased by 19.7% when compared to 2019 values. Many sectors saw strong sales growth in August 2021 compared to pre-pandemic August 2019: Sales increased by 37.5% at nonstore retailers, by 29.9% at sporting goods and hobby stores, by 23.2% at garden supply and building material retailers, by 20.5% at furniture and home-furnishing stores, by 20.5% at miscellaneous store retailers and by 14.5% at general merchandise stores. Department store sales continue to recover, growing 6.3% in August 2021 compared to pre-pandemic 2019 values. |
Total Retail Sales ex. Automobiles and Gasoline: YoY % Change 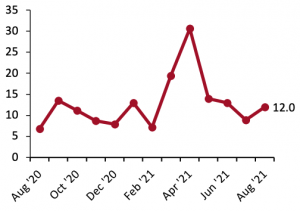
|
UK
| What’s New? | Trend Data | Positive or Negative* |
| Earnings vs. Inflation: In the UK, inflation slightly increased to 3.0% in August after slightly decelerating in July. Average earnings growth decelerated to 7.1% in July (latest data), from 8.8% in June, against weak comparatives from 2020. In August 2021, the number of payroll employees increased by 836,000 or 3.0% year over year. Median monthly pay increased by 5.3% compared to August 2020. Month over month, August saw the number of payroll employees rise by 241,000, or 0.8%, from July. The largest job growth in August was in the administrative and support services sector, while the transportation sector saw the largest number of job losses. At the end of the second quarter of 2021, the retail subsector remained 10,000 vacancies below its pre-pandemic size. However, retail exhibited strong sales growth quarter over quarter as it continues to recover toward pre-pandemic values. |
Average Weekly Earnings vs. Consumer Prices: YoY % Change [caption id="attachment_133039" align="aligncenter" width="300"]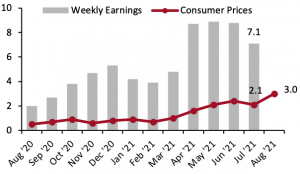 Latest earnings data are for July[/caption] Latest earnings data are for July[/caption] |
|
| Food and Fuel Prices: Higher costs for food and automotive fuel can impact discretionary spending. In August, UK food prices increased year over year for the first time since October 2020. Automotive fuel price inflation remained flat from July to August—but remains very high due to a rapid recovery in demand. |
Consumer Prices for Food at Home and Automotive Fuel: YoY % Change 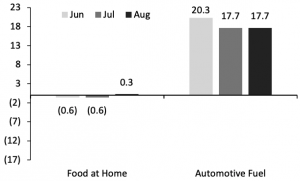 |
|
| Retail Sales: Total UK retail sales growth continued its downward trend, at 1.4% year over year. On a two-year basis (versus pre-pandemic 2019), August retail sales showed a similar pattern, growing just 5.7%, remaining flat from July’s 5.7% (revised) growth and down from June’s 10.7% two-year growth rate. Clothing specialists’ sales increased by 7.5% year over year in August 2021. Compared to 2019, specialists’ sales declined by 9.4%. On a two-year basis, sales at department stores—which have been severely challenged during the pandemic—decreased by 5.5% in August, following a 3.7% decline in July on a two-year basis. Health and beauty sales were up 5.9% in August 2021 compared to two years prior, which is an acceleration from 3.4% in July. Online sales accounted for 25.5% of all retail sales in August. Despite accounting for a quarter of all retail sales, online sales growth stayed negative, declining by 4.3% year over year. |
Total Retail Sales ex. Automobiles and Automotive Fuel: YoY % Change [caption id="attachment_133042" align="aligncenter" width="300"]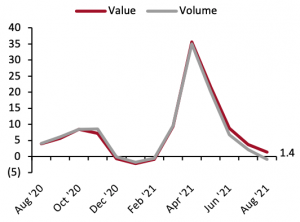 Data are not seasonally adjusted[/caption] Data are not seasonally adjusted[/caption] |
|
China
| What’s New? | Trend Data | Positive or Negative* |
| Income vs. Inflation: In China, the consumer price index grew 0.8% in August, slightly down from July’s 1.0% growth. Data on per capita disposable income are released quarterly. In the second quarter of 2021, per capita disposable income grew 12.6% year over year, down slightly from 13.7% growth in the first quarter of 2021, as the economy continued to recover steadily. |
Per Capita Disposable Income vs. Consumer Prices: YoY % Change [caption id="attachment_133043" align="aligncenter" width="300"]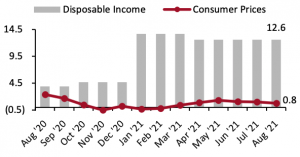 Disposable income data are quarterly[/caption] Disposable income data are quarterly[/caption] |
|
| Food and Fuel Prices: Higher costs for food and automotive fuel can impact discretionary spending. In August, food prices in China decreased by 2.0%, a slight improvement from the 3.7% decline in July. Beijing’s fuel price inflation increased 24.1% year-over-year, due to weak comparatives from August 2020. |
Consumer Prices for Food at Home and Automotive Fuel: YoY % Change 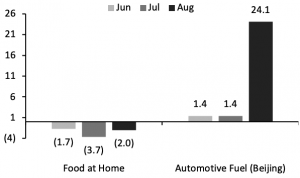 |
|
| Retail Sales: Retail sales growth in China slowed to 3.3% in August, its slowest growth in a year. On a two-year basis, retail sales grew 3.0%, down from July’s 6.0% two-year growth rate. Apparel and footwear sales notably declined by 6.0% year over year and 4.9% on a two-year basis. This sector is likely impacted by China’s strict Covid-19 restrictions aiming to contain local outbreaks. Beauty retailers did not experience growth year over year in August, but grew 26.7% on a two-year basis. School and office supplies and computers exhibited the highest growth in August, growing 20.4% year over year and 20.5% on a two-year basis. Food retailers saw steady year-over-year growth of 9.5% in August 2021. The sector saw two-year growth of 9.3%. |
Total Retail Sales incl. Automobiles and Gasoline: YoY % Change [caption id="attachment_133045" align="aligncenter" width="300"]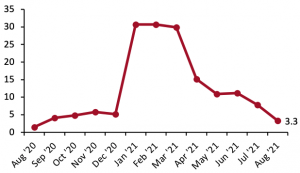 From December 2020, our China retail sales index excludes food-service sales; data in prior reports included food-service sales. Data for January and February 2021 are aggregated[/caption] From December 2020, our China retail sales index excludes food-service sales; data in prior reports included food-service sales. Data for January and February 2021 are aggregated[/caption] |