DIpil Das
The Coresight Research US Retail Traffic and In-Store Metrics report reviews year-over-year changes in selected store-based metrics as reported by RetailNext. In this month’s report, we review store traffic changes through August, when nonessential businesses continued to reopen, and some states revisited their reopening plans on indoor malls as the spikes in coronavirus cases slowed toward the end of the month. RetailNext’s coverage does not include food retailers but does include some other retail sectors deemed essential; the exclusion of food retail means that the figures cited below almost certainly overstate recent declines in total retail traffic.
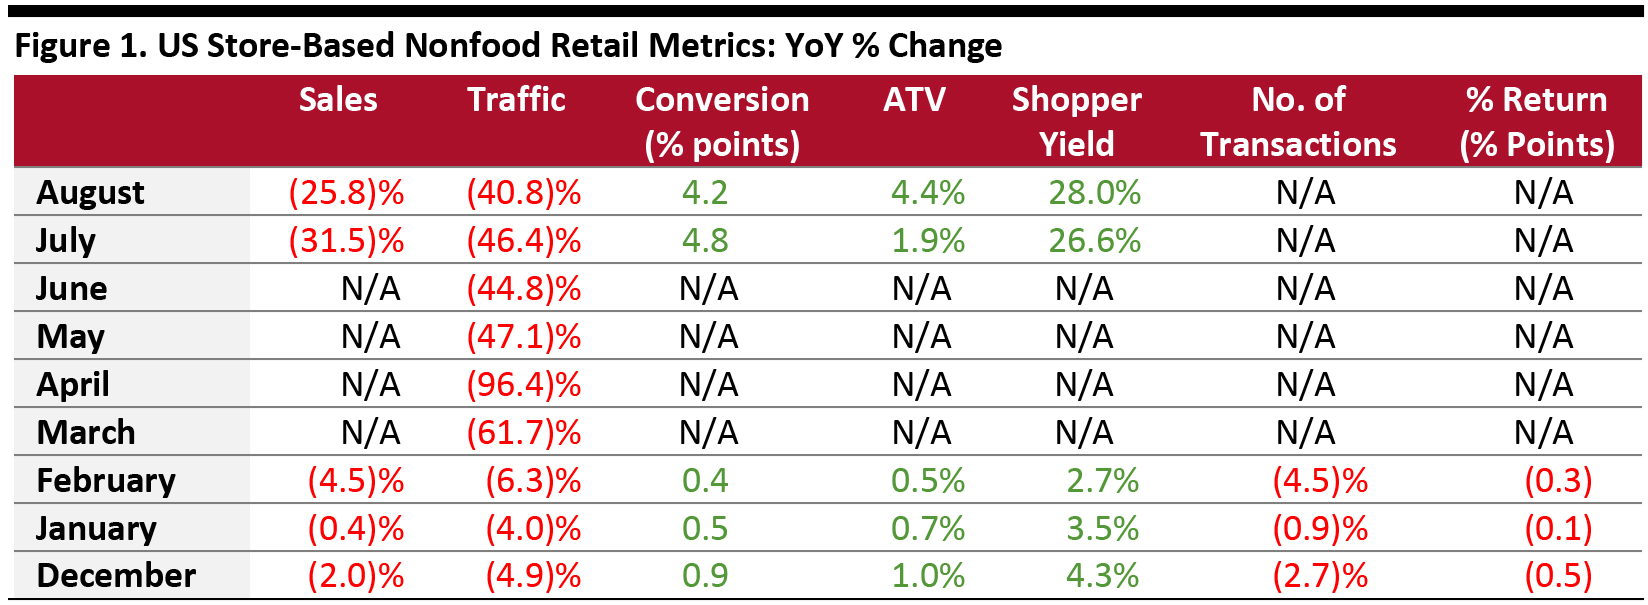 ATV=average transaction value; % Return=percentage of goods returned to stores
Source: RetailNext [/caption] Weekly Shopper Traffic Trends Weekly data for August tracks the progress of store reopenings over four weeks (August 2–August 29, 2020):
- Total US nonfood traffic declined by 40.8% year over year in August versus July’s 46.4% decline, reflecting further recovery for store-based discretionary retail.
- The conversion rate (sales transactions as a percentage of traffic) advanced by 4.2 percentage points in August versus July’s 4.8-percentage-point growth.
- In August, ATV (sales divided by transactions) increased by 4.4%, up from July’s 1.9% growth.
- Shopper yield (sales divided by traffic) grew 28.0% in August, up from July’s 26.6% increase.
- RetailNext did not publish the data for transaction volume and product return rates.
ATV=average transaction value; % Return=percentage of goods returned to stores Source: RetailNext [/caption] Weekly Shopper Traffic Trends Weekly data for August tracks the progress of store reopenings over four weeks (August 2–August 29, 2020):
- Traffic declined by 41.7% in the first week and 41.8% in the second week, an improvement from the final week of July, which saw traffic decline by 46.5%.
- Declines eased slightly to 39.7% in the third week of August and 40.2% in the fourth week as some states resumed reopening plans, with the growth in coronavirus cases slowing slightly toward the end of the month.
- The footwear sector experienced the greatest traffic decline at 47.3%, followed by the apparel sector, which saw a 43.9% decrease in traffic.
- The home sector posted the lowest decline in traffic, at 29.6%.
- The jewelry sector reported a traffic decline of 40.2%.
- The West saw the greatest traffic decline of 42.2% as many states, including California and Washington, had closed indoor malls due to the rise in Covid-19 cases in July. Furthermore, traffic was negatively impacted by a heatwave throughout the region in the second week of August and multiple fires in the Northern part of California in the third week of the month.
- The South posted the lowest decline in traffic, at 36.5%. Although traffic dipped slightly in the second week due to Hurricane Isaias, it continued to improve week over week.
- The Midwest was the second-best performing region, posting a traffic decline of 37.4%. However, this trend is expected to slow in the next month as the coronavirus cases started to rise throughout the region in the last week of August.
- The Northeast posted a traffic decline of 39.3%. The region is witnessing a slower rebound as many states have been cautious in reopening. Overall, weekly traffic remained roughly flat week over week, although the second week saw a slight decline due to the impacts of Hurricane Isaias.
- Traffic by mall location type declined between 23% and 50%, with strip malls outperforming other location types by more than 10 percentage points, with a decline of only 23.9%.
- Street-front and standalone locations performed second best, with declines of 32.2%, while outdoor locations saw a decline of 40.5%.
- Luxury, outlet and traditional mall locations performed the worst, with traffic declines of between 41% and 50%.
- About 69% of retailers expect overall retail traffic and performance to return to pre-Covid levels in 12–24 months, a longer recovery period compared to their expectations during the March/April period, when 74% of retailers expected retail traffic to return to pre-Covid levels in three to 12 months.
- About 59% of retailers have reopened all stores, while 29% have reopened some stores and 12% have reopened stores but closed them again. About 59% of retailers have discussed or are currently in discussions with landlords about abatement of rent or modifications in leases.
- Since reopening stores, 71% of retailers have reduced staffing hours, of which most have reduced staff hours by 25%. About 88% of retailers furloughed or laid off employees, of which most have hired back at least 75% of the employees.
- Many retailers have expanded their omnichannel capabilities: 82% of retailers have implemented or plan to implement a BOPIS (buy online, pick up in store) model, while 65% of retailers have implemented or plan to implement ship-from-store capabilities. Retailers plan to use 65% of their stores as showrooms.
- To encourage in-store shopping, retailers have adopted new tools or technologies, including contactless payments (71% of retailers), virtual appointments (71%), messaging systems (47%), task management systems (35%) and on-the-ground training solutions (29%).
- In terms of the top challenges faced by retailers, about 88% of retailers said that driving traffic to stores remains their biggest challenge, while 71% of respondents cited managing supply chain disruptions. Other challenges faced by retailers are shoring up cash reserves (35% of respondents), managing demand fluctuations (29%) and complying with evolving guidelines and mandates (24%).
- For the holiday shopping season, most retailers are cautious and conservative. About 71% of retailers are allocating more resources toward e-commerce channels, while 24% of retailers are allocating equal resources across channels.
- associates and about 17% of retailers have not yet taken a decision on the number of store associates they will require.
- About 80% of retailers have, or plan to implement, new health and safety practices in stores, while 68% of retailers have, or plan to implement, occupancy controls.