DIpil Das
[caption id="attachment_95889" align="aligncenter" width="700"]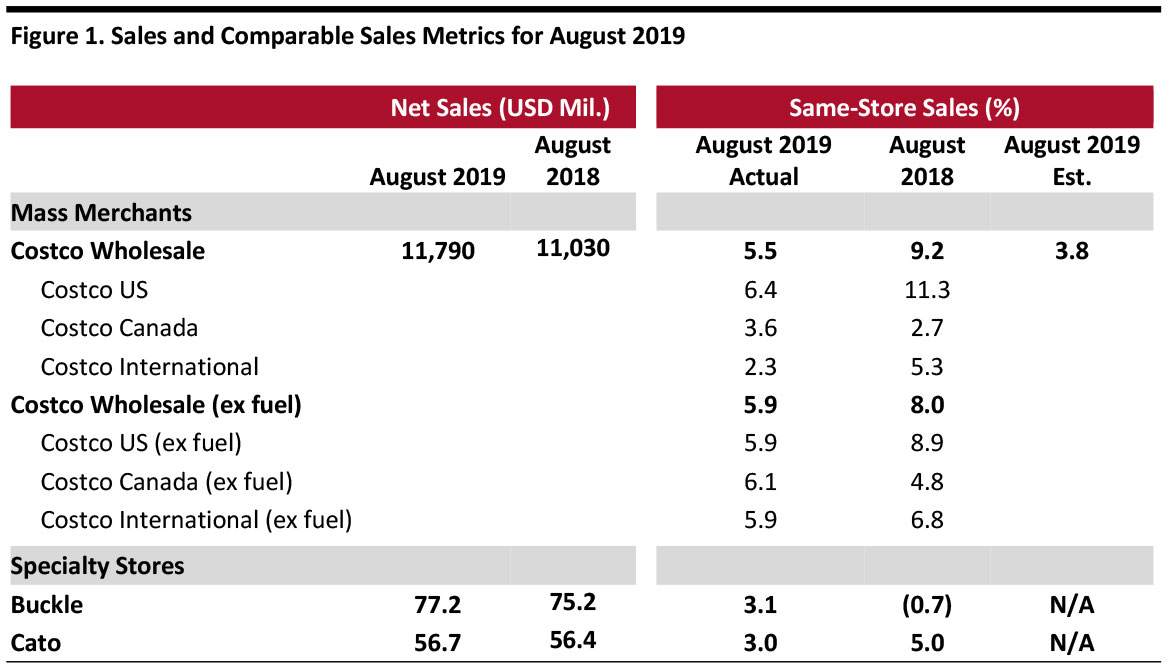 Source: Company reports/StreetAccount[/caption]
Costco Comps Above Consensus; Online Comparable Sales Growth Accelerates
Source: Company reports/StreetAccount[/caption]
Costco Comps Above Consensus; Online Comparable Sales Growth Accelerates
Source: Company reports/StreetAccount[/caption]
Costco Comps Above Consensus; Online Comparable Sales Growth Accelerates
- In August, Costco grew global same-store sales by 5.5% year over year, marginally lower than the 5.6% growth in July but substantially ahead of the consensus estimate of 3.8% recorded by StreetAccount. Ex fuel, global comps were up 5.9% in August.
- Costco’s online comparable sales growth was 23.9% in August, gaining speed over July’s 21.3% growth.
- Ex fuel, Costco US comps were up 5.9% in August, slightly higher than July’s 5.3% growth. In terms of US regions, the retailer saw the strongest results in the Midwest, Texas and Los Angeles in August. Internationally, Costco saw strong sales growth in Taiwan, Mexico and Spain.
- Currency fluctuations negatively impacted comps. Canada same-store sales growth was hurt by about 180 basis points (bps), while other international comp growth was negatively impacted by approximately 330 bps. Overall, group comparable sales were negatively impacted by 60 bps.
- Cannibalization negatively impacted US comps by about 40 bps, Canada by 30 bps and other international segments by approximately 170 bps. Overall, cannibalization negatively impacted comparable sales by 50 bps.
- In the merchandise segment, excluding currency effects, comps for food and sundries were positive mid-single digits; departments that showed the strongest results were candy, liquor and deli. Hardlines posted comps in the positive high-single digits; the departments that performed strongest were automotive, sporting goods and majors. Softlines were up low-single digits; the departments that showed better performance were kiosks, home furnishings and apparel.
- Fresh food comparable sales were up mid-single digits, with service deli and produce being better-performing departments. In the ancillary businesses, hearing aids, optical and the food court businesses saw the strongest comp sales increases.
- Gasoline price deflation negatively impacted total comps by about 80 bps; the overall average selling price decreased to $2.81 per gallon this year from $2.99 last year.
- Buckle’s comparable sales increased 3.1% year over year in August, compared to a 0.5% decrease in July. In August, net sales increased 2.6% year over year versus a 0.8% decline in July.
- By business segment, total sales in men’s were up 5.5% year over year. The men’s segment accounted for approximately 54% of total sales in August 2019, compared to 53% in August 2018. In August, price points were down by about 1.5% in the men’s segment.
- Total sales in the women’s segment were up 0.5% year over year. The women’s segment accounted for 46% of total sales in August 2019, down from 47% in August 2018. In the women’s business, price points were down about 4% in August.
- By product type, accessories sales were up 5.5% year over year in August and accounted for 8.5% of total sales. Footwear sales grew 32% year over year and represented 7.5% of total sales. Average accessory price points decreased about 9.5% and average footwear price points were down about 7.5%.
- In August, units per transaction grew about 2% and the average transaction value fell approximately 1%.
- Cato’s sales increased 1.0% year over year to $56.7 million, maintaining the same growth rate as July. Comparable sales increased 3.0% year over year in August, slowing from 4.0% in July.
- The company’s CEO John Cato commented that “August same-store sales exceeded our expectations. We continue to be encouraged by our current trend. However, we remain cautiously optimistic about the rest of the year given the difficult retail environment and the impact of the new tariffs."
- As of August 31, 2019, the company operated 1,299 stores in 31 states, down from 1,350 stores in 33 states as of September 1, 2018.