DIpil Das
Our US Monthly Retail Traffic and In-Store Metrics Report reviews year-over-year changes in selected store-based metrics, including sales, traffic and conversion rates.
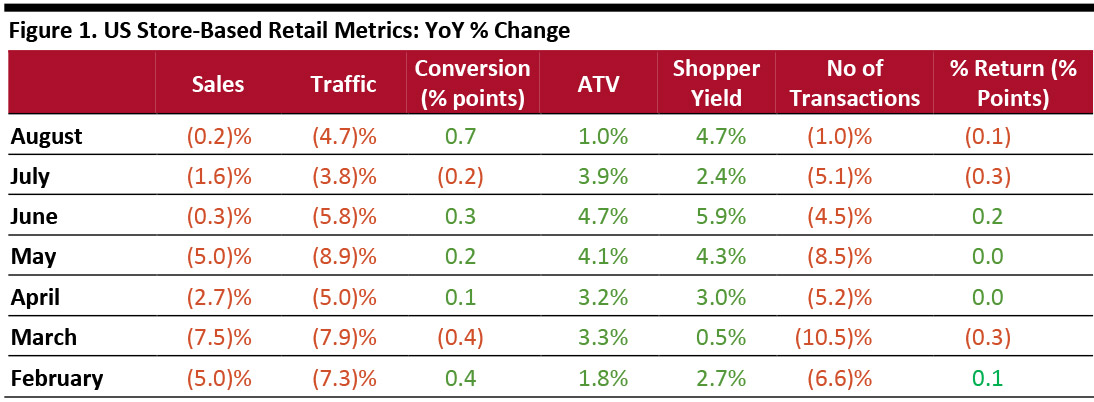 ATV = average transaction value, % Return = percentage of goods returned to stores
Source: RetailNext [/caption] Data for August showed performance varied over the course of the four weeks:
- US store-based traffic continued to fall in August, according to RetailNext. Retail traffic decreased 4.7% year over year in August, worsening from the 3.8% decline in July.
- The conversion rate (sales transactions as a percentage of traffic) advanced 0.7 percentage points in August after declining 0.2 percentage points in July.
- The product return rate decreased 0.1 percentage points in August, slower than the 0.3 percentage point decline in July.
- ATV (sales divided by transactions) grew 1.0% in August, slower than the 4.7% and 3.9% growth reported in June and July, respectively.
- Shopper yield (sales divided by traffic) grew 4.7% year over year in August, accelerating from the 2.4% increase in July.
ATV = average transaction value, % Return = percentage of goods returned to stores Source: RetailNext [/caption] Data for August showed performance varied over the course of the four weeks:
- The last week of August, leading up to the three-day Labor Day weekend, performed the best for sales, conversion rates, transactions and shopper yield.
- August 10 performed the best for traffic, while August 20 reported the lowest performance for traffic.
- Sales, ATV, conversion rates, shopper yield and transaction volumes were lowest on August 7.