Excluding motor vehicles and parts
Source: comScore/US Census Bureau
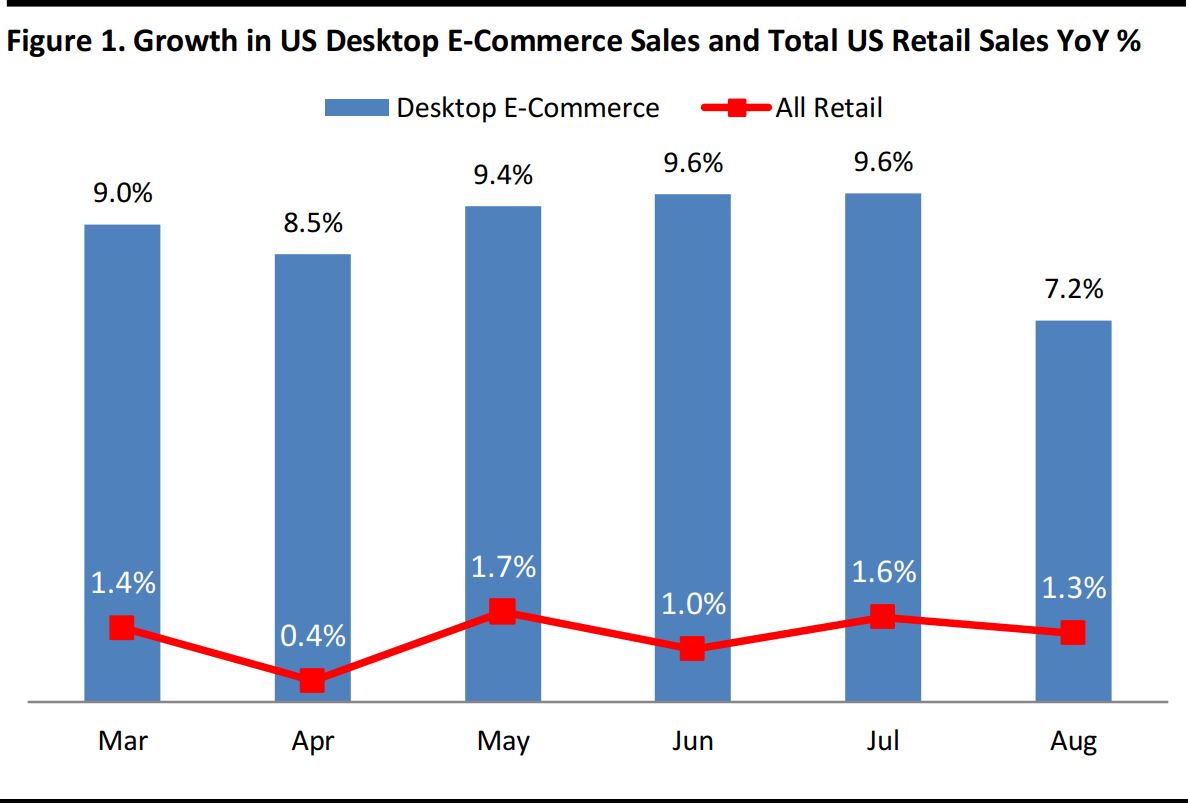
August continued an underwhelming back-to-school shopping season. Retail sales were up 1.3% year over year, while desktop sales climbed 7.2% year over year. Analysts expected back-to-school sales to soften this year, so August’s retail sales growth is roughly in line with expectations.
comScore’s data are for retail (excluding auction sites, event tickets and nonretail travel) and desktop transactions only. The data exclude transactions made via smartphone or tablet devices, which account for a sizable and growing share of total e-commerce sales. Therefore, the data underrepresent year-over-year growth rates in e-commerce. Indeed, given the speed at which the number of mobile transactions is growing, FBIC believes desktop sales growth will slow in the not-too-distant future.
THE RUNDOWN BY CATEGORY FOR AUGUST
*Nonretail categories
Source: comScore/FBIC Global Retail & Technology
SLIGHTLY POSITIVE AUGUST E-COMMERCE RESULTS
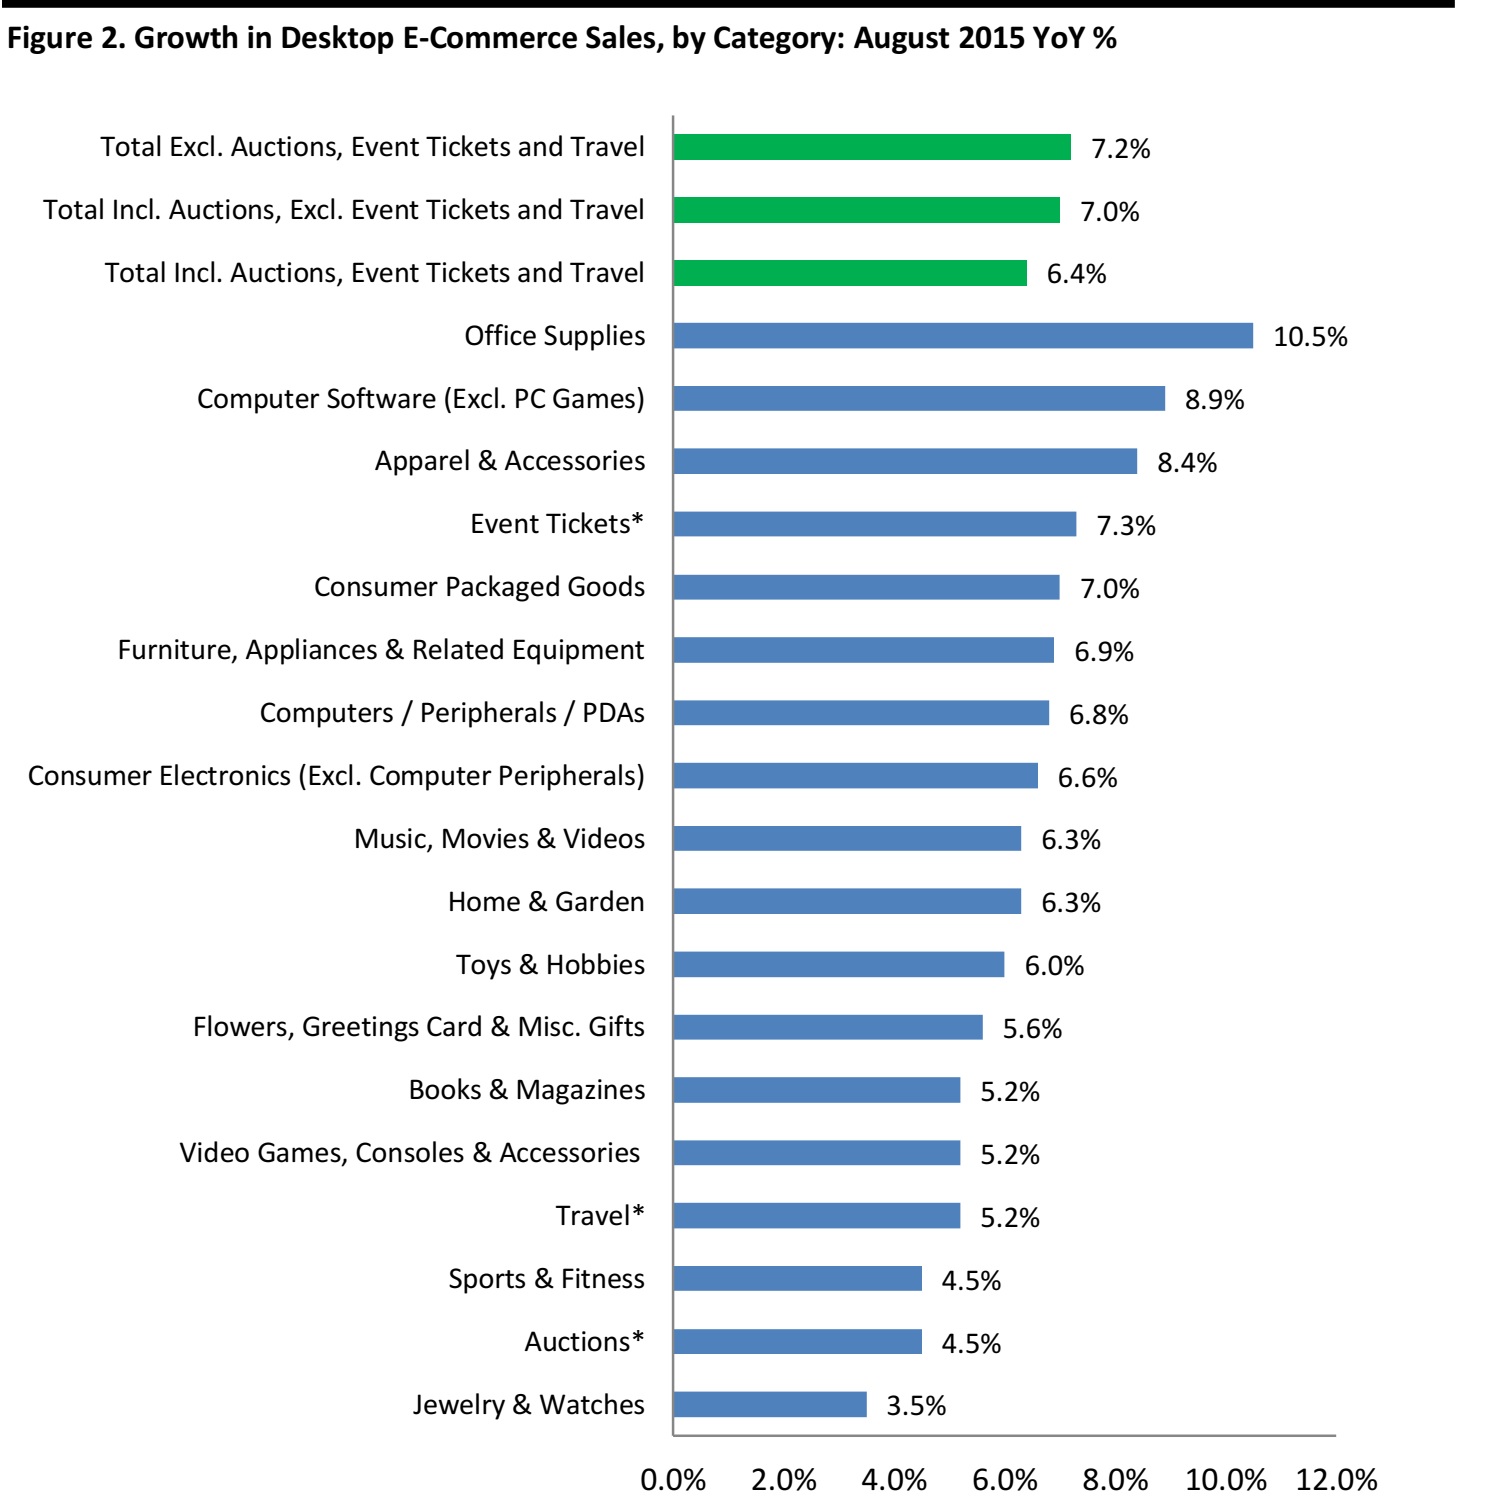
- In August, online desktop retail spending increased by 7.2% year over year to $18.5 billion, excluding auction sites, event tickets and travel.
- Notable segments that positively contributed to the August results included:
- Apparel and accessories: up 8.4% year over year (two percentage points lower than in July), to $2.8 billion
- Office supplies: up 10.5% year over year, to $935 million
- Computer software (excluding PC games): up 8.9% year over year, to $219 million
- Consumer electronics (excluding computer peripherals): up 6.6% year over year, to $1.5 billion
- Furniture, appliances and related equipment: up 6.9% year over year, to $833 million
- Growth weaker in August. The sports and fitness category was up 4.5% year over year in August, versus its 9.8% growth rate in July, and the jewelry and watches category was up 3.5% year over year in August, decelerating versus its 9.9% rate in July. The books and magazines category lagged many others, growing just 5.2% year over year.
- Online desktop retail spending, excluding travel and event tickets, rose by 7.0% in August, to $20.4 billion. It rose by 8.6% year over year in the second quarter. Auctions experienced growth of 4.4% year over year.
- Total US online desktop spending rose by 6.4% in August, to $32.8 billion. Online spending on travel was up 5.2% year over year: hotel reservations were up by 6.4%, air travel up by 7%, car rental up by 5.5% and travel packages up by 1.5%.
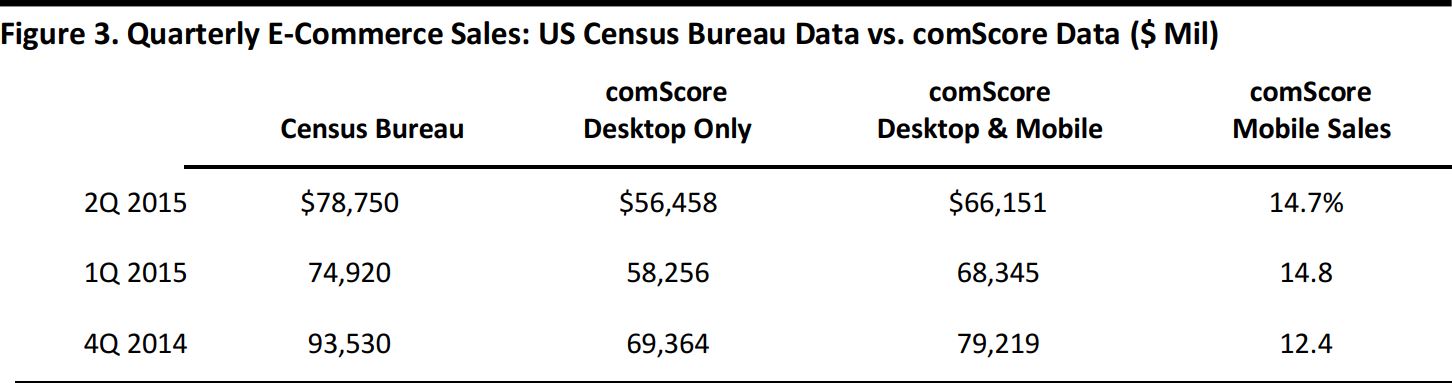
QUARTERLY: US CENSUS BUREAU DATA VS. COMSCORE DATA
The US Census Bureau offers quarterly data on e-commerce sales. This data set includes m-commerce, capturing a broader sample of total online sales. The Census Bureau reported that total online retail sales grew by 14.4% year over year in the second quarter of 2015, to $78.8 billion. These sales accounted for 6.6% of total retail sales, according to the Bureau.
comScore data are for retail only, excluding auctions, event tickets and travel.
Source: comScore/US Census Bureau/FBIC Global Retail & Technology
comScore estimates that total e-commerce retail desktop and mobile sales were $66.2 billion in the second quarter, up 13.8% over the same quarter last year. It reported that total mobile retail sales reached $9.7 billion in the second quarter, with smartphones accounting for $5.7 billion and tablets for $4 billion. Mobile retail sales were up significantly year over year, by 52.2%.
Total retail desktop spending increased by 9.1%, to $56.5 billion, in the second quarter. Total mobile sales captured 14.7% of digital dollars, comScore reports, indicating a noteworthy mobile-monetization-gap opportunity for retailers that are investing in mobile and tablet apps.
COMSCORE VISITOR DATA
comScore’s visitor data include mobile and desktop visits, which provide a fuller picture than e-commerce figures alone. Please note that comScore visitor data track only smartphone and tablet data for mobile purchases.
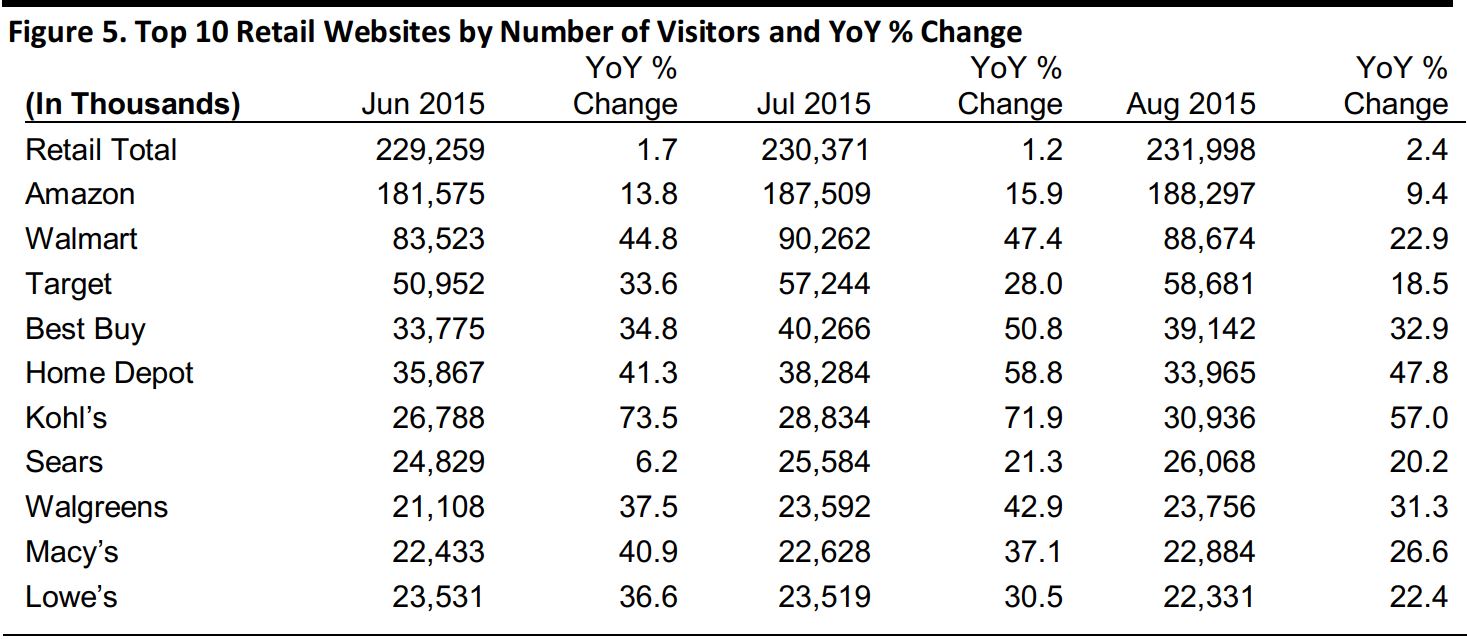
Total unique visitors to all retail websites grew by 2.4% year over year in August, according to comScore, reflecting the maturity of the Internet channel in the US. Value growth online is principally being driven by existing Internet users spending more online.
Store-based retailers Kohl’s and Home Depot saw some of the strongest visitor growth in August. This reflects the catch-up process some store-based retailers are playing as they seek to meet the new demand of online shoppers and compete with pure plays, which have enjoyed a head start when it comes to the online channel.
Source: comScore/FBIC Global Retail & Technology
Amazon: Amazon experienced 9.4% visitor growth in August, with 188 million unique visitors, making it the most visited website. Since June, Amazon has gained an average of 3.4 million unique visitors per month. We believe visitor figures were increased by Amazon’s Prime Day, when over 30 million items were ordered across Prime-eligible countries (three million new Prime members were registered in the US by the end of July). The Prime enrollments peaked the day before Prime Day at 14 times the prior 2015 daily average.
Walmart: Walmart enjoyed year-over-year overall site traffic growth of 22.9% in August. Walmart.com was the second-most-visited website behind Amazon in the month with almost 89 million unique visitors. The strong growth was driven by the company’s recent efforts to strengthen its app and simplify the checkout process on Walmart.com. Last year Walmart’s mobile site took 7.2 seconds to load. The retailer cut tis load time from 7.2 seconds to 2.9 seconds, reportedly increasing conversions by 2%. Also, Walmart opened two new automated online fulfillment centers in the fiscal second quarter, and it plans to open two more in the fiscal third quarter to efficiently scale fast delivery to customers all across the US.
Kohl’s: In August, Kohl’s enjoyed the highest year-over-year site traffic growth among the top 10 retail websites. In recent months, traffic has grown by 50%–90%. Kohl’s expanded its buy online, pick up in store service to all stores, boosting its number of website visitors. In addition, more than 1,000 Kohl’s stores can now fulfil online orders, reducing shipping time. Kohl’s has unveiled new shopping tools, too, including a store mode for the Kohl’s mobile app; enhanced mobile payment options, such as Apple Pay; a cross-platform omni-channel shopping bag; and Visa Checkout on Kohls.com and on mobile. The retailer’s online traffic grew by 57% year over year in August.
Home Depot: Home Depot experienced the second-highest year-over-year growth among the top 10 retailers. Home Depot’s online sales grew by approximately 25% last quarter, led by omnichannel initiatives such as buy online, ship to store; buy online, pick up in store; and buy online, return in store. These are all key growth factors for increasing online traffic. The company is also investing in its supply chain to support online growth, completing a fulfillment center in Troy Township, Ohio. The center will allow the company to ship parcels to 90% of US customers within two days or less, Home Depot’s CEO Craig Menear said. Home Depot’s site traffic grew by 47.8% year over year in August.
Source: comScore/FBIC Global Retail & Technology
SEPTEMBER RESULTS PREVIEW
We expect US shoppers to be cautious with their spending in September. Average hourly earnings climbed just 2.2% in August year over year along with slowing global growth and financial market volatility which may contribute to consumers’ reluctancey to spend, despite higher employment rates, better home values and lower gas prices.
We expect September visitor and e-commerce figures to benefit somewhat from Halloween, with over 150 million Americans predicted to celebrate according to the NRF. We will be watching newly launched e-commerce platform Jet.com since the number of shopping visitors rose by 24% from August 1 through September 16, according to big data analytics firm 1010data. It remains to be seen how online shoppers continue to respond to the e-commerce site claiming to offer prices 10-15% lower, on average, than Amazon’s.
According to comScore, only 1.5% of the $1.4 trillion consumer-packaged-goods business is online. The segment should see higher levels of digital sales growth driven by pure plays: Amazon, for example, is increasing its efforts in the category. Consumer packaged goods ranked third (excluding travel) in absolute dollar spending in August, but saw the second-to-lowest growth rate of all retail sectors in the second quarter.
According to comScore, 51% of e-commerce shoppers view free shipping as the most essential factor in online shopping, while only 28% cite the availability of online-only discounts as their top priority. Recent improvements in shipping speeds and buy online, pick up in store options will be key for the holiday season this year. We expect more multi-channel retailers to use these strategies to convert online visitors to in-store purchases, as Kohl’s, Home Depot and Macy’s have done.