Nitheesh NH
US Retail Traffic and In-Store Metrics: April 2022
The Coresight Research US Retail Traffic and In-Store Metrics series reviews changes in selected store-based metrics, as reported by RetailNext. In this month’s report, we review store traffic changes through April 2022—which saw an acceleration in traffic growth at 20.9% compared to March’s 16.5% increase year over year. Year-over-year changes are our core metric for store-based data; however, due to Covid-19 all data in this report from April to July 2021 is compared to 2019 (pre-pandemic), because there were widespread store closures from April to July 2020. From August 2021 onward, the comparison is made on a year-over-year basis.- In April, ATV (average transaction value, or sales divided by transactions) increased by 4.5%, equaling March’s growth of 4.5%. The average ticket size continues to be impacted by inflation.
- The conversion rate (sales transactions as a percentage of traffic) decreased by 2.1 percentage points in April, versus March’s 2.2 percentage points decline year over year, due to shoppers' ongoing weaker intent to purchase amid high inflation.
- Shopper yield (sales divided by traffic) decreased by 3.0% in April, versus March’s 3.1% decline year over year.
- Unit per transaction (number of items purchased divided by number of transactions) decreased by 0.2% in April, lower than March’s 4.1% decline.
- Average unit retail (net sales divided by units sold) increased by 5.9% in April, lower than March’s 10.7% growth year over year.
Figure 1. US Store-Based Traffic and Sales: YoY % Change [caption id="attachment_147233" align="aligncenter" width="700"]
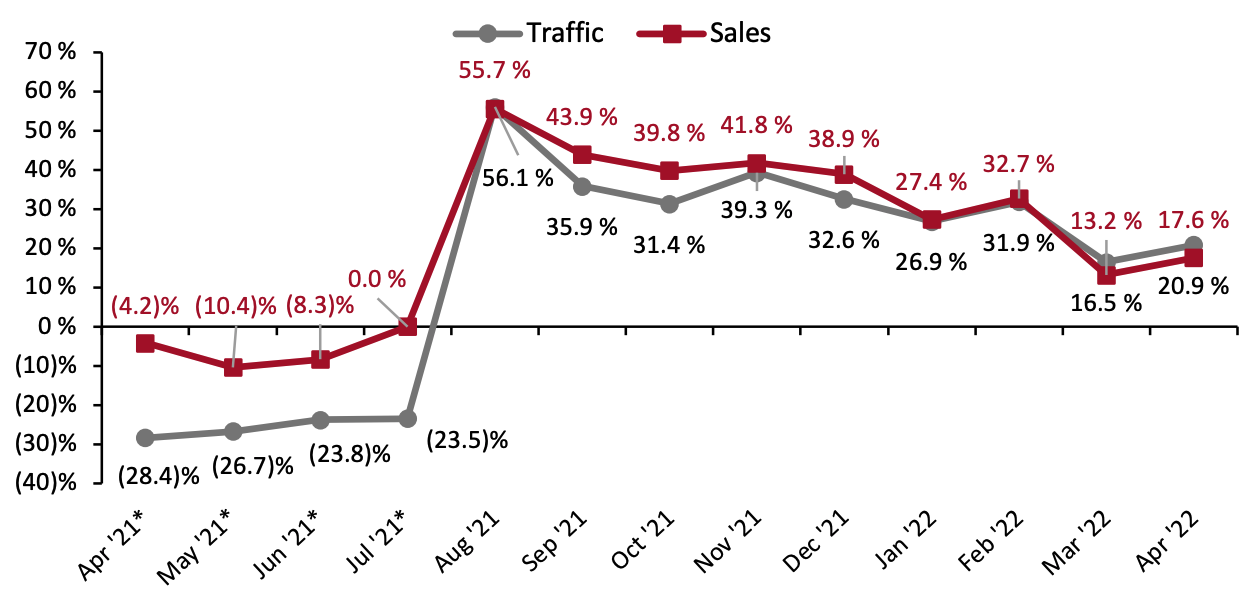 *April–July 2021 numbers are two-year % change due to store closures in the comparable period in 2020
Source: RetailNext[/caption]
Figure 2. US Store-Based Nonfood Retail Metrics: YoY % Change [caption id="attachment_147234" align="aligncenter" width="700"]
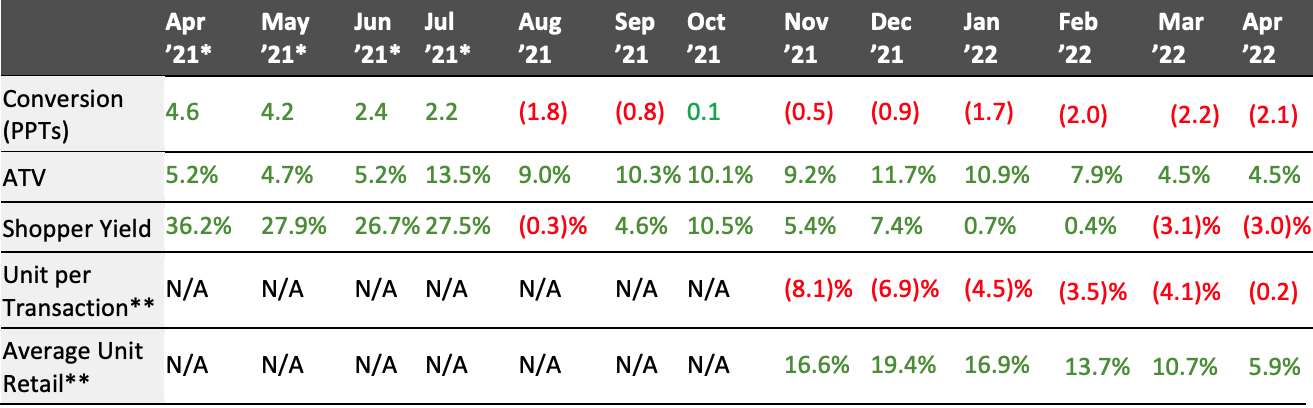 ATV=average transaction value; Shopper yield=Sales divided by traffic
*April–July 2021 numbers are two-year % change due to store closures in the comparable period in 2020
**RetailNext started providing data on these from November 2021
Source: RetailNext[/caption] Weekly Shopper Traffic Trends Weekly data for April tracks the progress of store traffic over four weeks (April 3, 2022– April 30, 2022):
- On a week-by -week basis, traffic performance displayed a mixed trend as the month progressed. In the first week of April, traffic increased by 12.9% improving from the final week of March, which saw a traffic increase of 6.2%.
- The second week witnessed the best traffic trends, a 29.3% increase on a year-over-year basis due to a 49% surge in traffic on Friday, April 15 leading up to the Easter weekend.
- As the month progressed, traffic performance showed a decelerating trend. Traffic growth decelerated to 26.3% in the third week. In the fourth week, traffic growth further decelerated to 15.8%.
- In April, apparel was the best performing sector and saw a traffic increase of 34.4% year over year. It was about 920 basis points (bps) higher than March. The second week had the best traffic trend in the apparel category, which was due to traffic driven up by Friday, April 15 leading up to Easter weekend.
- Footwear performed the second-best in traffic trends, increasing by 27.4% year over year, 1,070 bps higher than March. The second week saw the strongest traffic trend in footwear category.
- In April, the health and beauty sector saw a traffic increase of 26.6% on a year-over-year basis, about 660 bps higher than March. The health and beauty category saw improved traffic trends from the first week to the third week but witnessed deterioration in the fourth week.
- Traffic in the jewelry sector increased by 15.8% year over year—an increase of 10 bps from March. The second and third week saw the strongest traffic trend compared to other weeks in the jewelry category.
- The home sector saw the softest growth compared to other categories. The home category recorded a 4.8% decrease in traffic year over year, versus a 0.3% increase in March. The first and fourth week had the lowest traffic trend compared to other weeks. The third week had the best traffic trends, with traffic declining 2.0% year over year.
Figure 3. US Retail Traffic by Industry Vertical: YoY % Change [caption id="attachment_147461" align="aligncenter" width="700"]
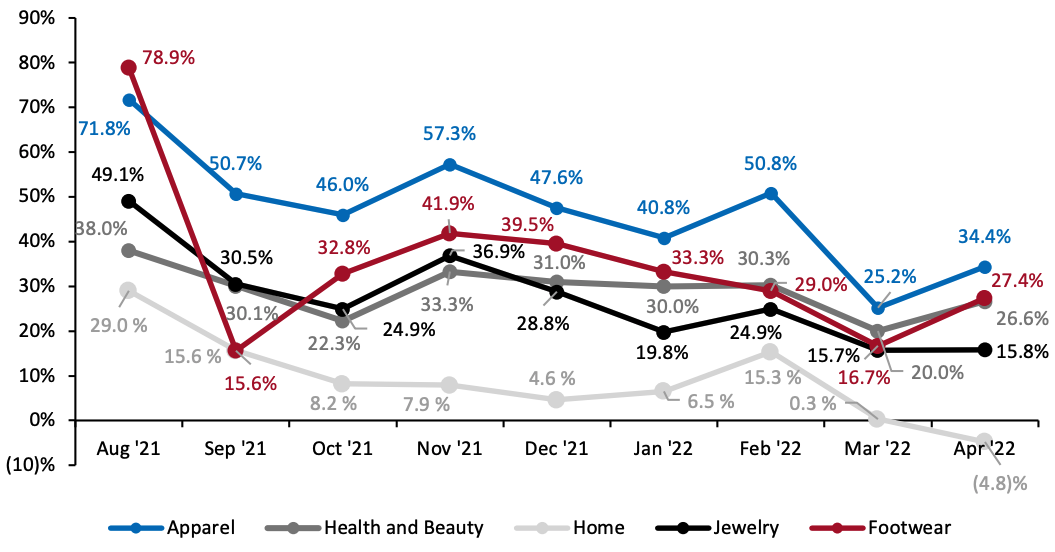 RetailNext started providing traffic trends by vertical on a year-over-year basis from August 2021
Source: RetailNext[/caption] Regional Traffic Trends There was a rise in Covid -19 cases in month of April. However, in the beginning of April, California lifted the requirement of proof of vaccination or a negative Covid-19 test for large indoor events with over 1000 people. Retail traffic in April varied across region.
- The Northeast performed best, as traffic increased by 32.8% year over year. The second and third week had the strongest traffic trends due to New York’s traffic growth of 63.0% and 55.0%, respectively.
- The West region performed second-best with traffic increasing by 18.1%, lower than March’s 21.0% growth year over year. The second and third week had the best traffic trends compared to other weeks due to California’s traffic growth of 30.0% and 26.0%, respectively.
- The South region’s traffic increased by 16.9% year over year. The second week had the best traffic trend of 25.9% compared to other weeks due to Florida’s traffic growth of 43.0%.
- The Midwest region experienced the softest traffic trend in April, with traffic increasing by 13.0%, still higher than March’s 7.0% growth year over year. The second week had the best traffic trends compared to other weeks due to traffic driven up by Friday, April 15 leading up to Easter weekend.
- Traffic by mall location type increased between 4.9% and 30.2% year over year.
- Luxury locations performed best compared to all other location types, increasing by 30.2% year over year.
- Other locations, including airports, casinos and hotels, performed second best with traffic increasing by 24.8%, followed by traditional malls which saw a 24.4% traffic increase year over year.
- Street-front/freestanding locations saw a traffic increase of 23.0% while lifestyle centers reported traffic growth of 22.2% year over year.
- Outlet locations registered growth of 19.6% while strip malls performed the weakest this month, registering traffic growth of 4.9% year over year.