
DIpil Das
US
| What’s New? | Trend Data | Positive or Negative* |
| Earnings vs. Inflation: In March, the US saw another four-decade inflation high. Consumer prices increased 8.5% compared to a year ago, marking the highest inflation point since 1982. Inflation is being led by volatile gas prices, rising energy costs and food price increases. Average weekly earnings growth remained in line with recent trends, growing 4.6% from a year ago—although it is down from February’s 5.4% growth. Inflation continues to outpace earnings growth, cutting into consumers’ spending abilities. |
Average Weekly Earnings vs. Consumer Prices: YoY % Change [caption id="attachment_146175" align="aligncenter" width="300"]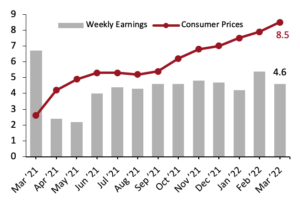 Data are not seasonally adjusted[/caption] Data are not seasonally adjusted[/caption] |
|
| Food and Fuel Prices: Food and gas price inflation rates are significant metrics because higher costs in these categories can impact discretionary spending. US food at home inflation continued to accelerate in March, with food prices rising 10.0% year over year. Meanwhile, gas prices continued to climb, growing 48.0% from the previous year. Upward pressure on the cost of food and gas is an economic consequence of the Russia-Ukraine conflict. |
Consumer Prices for Food at Home and Gasoline: YoY % Change [caption id="attachment_146176" align="aligncenter" width="300"]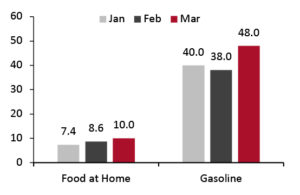 Data are not seasonally adjusted[/caption] Data are not seasonally adjusted[/caption] |
|
| Retail Sales: Total US retail sales, excluding gasoline and automobiles, remained positive despite losing momentum in March. Retail sales grew at a modest 4.0% from the previous year, down from February’s revised 13.1% year-over-year growth, indicating consumer spending is slowing amidst record-high inflation. Our estimated retail-only inflation metric stood at 8.1% year over year in March, versus 7.5% in February. The March data imply a real-terms retail sales decline of around 4.1%, year over year. |
Total Retail Sales ex. Automobiles and Gasoline: YoY % Change [caption id="attachment_146189" align="aligncenter" width="300"]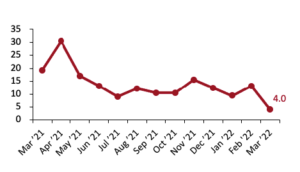 Data are not seasonally adjusted[/caption] Data are not seasonally adjusted[/caption] |
UK
| What’s New? | Trend Data | Positive or Negative* |
| Earnings vs. Inflation: In the UK, inflation remained elevated in March. Consumer prices grew 6.2%, marking a thirty-year inflation high for the UK. With inflation continuing to move upward, average weekly earnings growth has fallen behind the rise in consumer prices. Average weekly earnings growth grew 5.4% in February (latest available data) and is underpacing inflation, negatively affecting consumers’ spending abilities. |
Average Weekly Earnings vs. Consumer Prices: YoY % Change [caption id="attachment_146178" align="aligncenter" width="300"]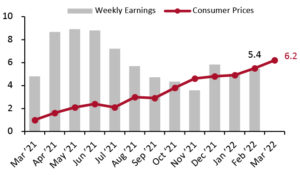 Latest earnings data are for December; consumer prices are CPIH[/caption] Latest earnings data are for December; consumer prices are CPIH[/caption] |
|
| Food and Fuel Prices: Higher food and automotive fuel costs can impact discretionary spending. In March, UK food price inflation continued a steady upward trend, rising to 5.9%, up from February’s 5.1% year-over-year growth. While automotive fuel price inflation had been easing, the Russia-Ukraine conflict put renewed pressure on the price of fuel. Automotive fuel prices grew 30.7% in March, up from February’s 22.3% year-over-year growth. |
Consumer Prices for Food at Home and Automotive Fuel: YoY % Change [caption id="attachment_146179" align="aligncenter" width="300"]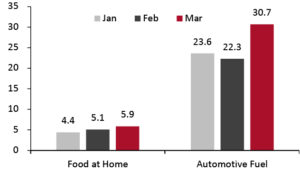 Data are not seasonally adjusted[/caption] Data are not seasonally adjusted[/caption] |
|
| Retail Sales: Like the US, total UK retail sales growth was modest in March. Retail sales grew 4.9% from the previous year. Notably, sales volumes declined by 2.5%, reflecting the impact of increasing prices. Consumers cannot purchase the same quantities of goods they were previously able to. |
Total Retail Sales ex. Automobiles and Automotive Fuel: YoY % Change [caption id="attachment_146180" align="aligncenter" width="300"]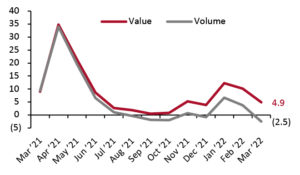 Data are not seasonally adjusted[/caption] Data are not seasonally adjusted[/caption] |
|
China
| What’s New? | Trend Data | Positive or Negative* |
| Income vs. Inflation: In China, the consumer price index growth accelerated slightly. Compared to last year, consumer prices increased 1.5% as inflation remains healthy, unlike in the US and UK. Per capita disposable income data are released quarterly in China. In the first quarter of 2021, per capita disposable income grew 6.3% from the previous year, picking up speed from the 5.4% growth in per capita disposable income in the fourth quarter of 2021. |
Per Capita Disposable Income vs. Consumer Prices: YoY % Change [caption id="attachment_146181" align="aligncenter" width="300"]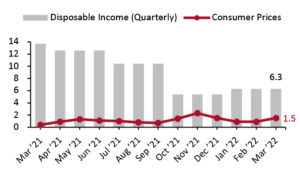 Disposable income data are quarterly[/caption] Disposable income data are quarterly[/caption] |
|
| Food and Fuel Prices: Higher costs for food and automotive fuel can impact discretionary spending. In March, China continued to witness food price deflation, with food prices declining marginally by (0.3)%. However, automotive fuel price inflation accelerated sharply due to the Russia-Ukraine conflict, with automotive fuel prices growing 52.1% year over year. |
Consumer Prices for Food at Home and Automotive Fuel: YoY % Change 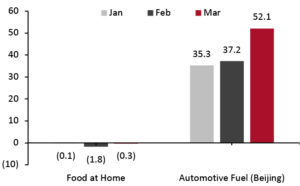 |
|
| Retail Sales: Total retail sales in China lost momentum in March. Retail sales declined by 2.1%—the first year-over-year decline in 20 months—because of the severity of lockdown measures implemented by the government to control recent Covid-19 outbreaks. |
Total Retail Sales ex. Food Service, incl. Automobiles and Gasoline: YoY % Change [caption id="attachment_146183" align="aligncenter" width="300"]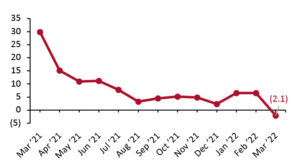 From December 2020, our China retail sales index excludes food-service sales; data in prior reports included food-service sales. Data for January and February 2021 are aggregated.[/caption] From December 2020, our China retail sales index excludes food-service sales; data in prior reports included food-service sales. Data for January and February 2021 are aggregated.[/caption] |