Nitheesh NH
The Coresight Research US Retail Traffic and In-Store Metrics series reviews changes in selected store-based metrics, as reported by RetailNext. In this month’s report, we review store traffic changes through April 2021—a month that was impacted by strong 2019 comparatives, which were, nevertheless, somewhat offset by the issuance of stimulus checks and the expansion of the Covid-19 vaccine eligibility. From the third week of April, individuals in the US aged 16 and higher are eligible for a Covid-19 vaccine. This series usually reviews year-over-year changes in store-based metrics; however, all April and March data in this report are compared to 2019 as stores began closing in March 2020 due to Covid-19 and most stores were closed in April 2020.
RetailNext’s coverage does not include food retailers but does include some other retail sectors deemed essential; the exclusion of food retail means that the figures cited below almost certainly overstate recent declines in total retail traffic.
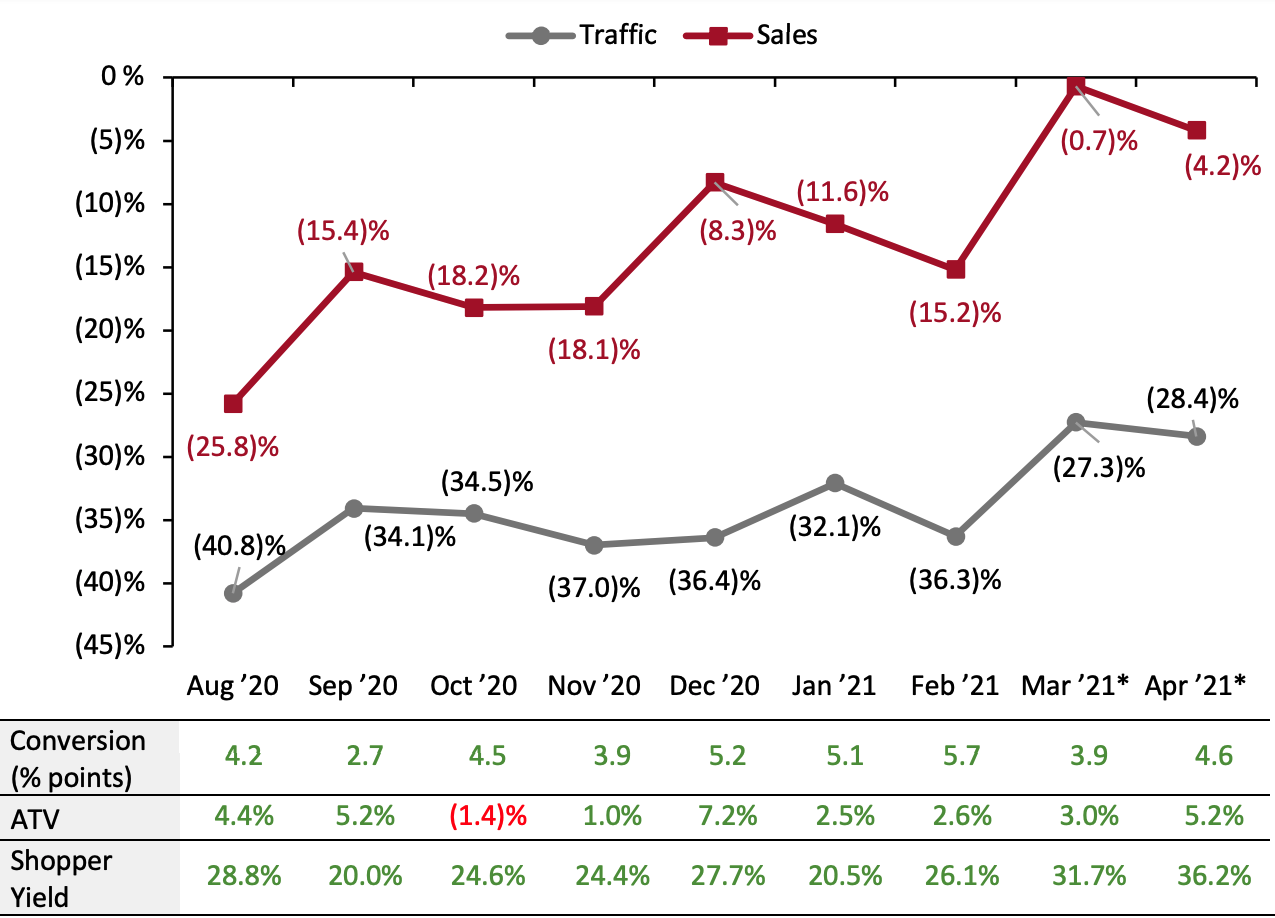 ATV=average transaction value; Shopper yield= Sales divided by traffic
*March and April 2021 numbers are compared to 2019 as stores began closing in March 2020 due to Covid-19 and most stores were closed in April 2020.
Source: RetailNext[/caption] Weekly Shopper Traffic Trends Weekly data for April tracks the progress of store traffic over four weeks (April 4, 2021–May 1, 2021):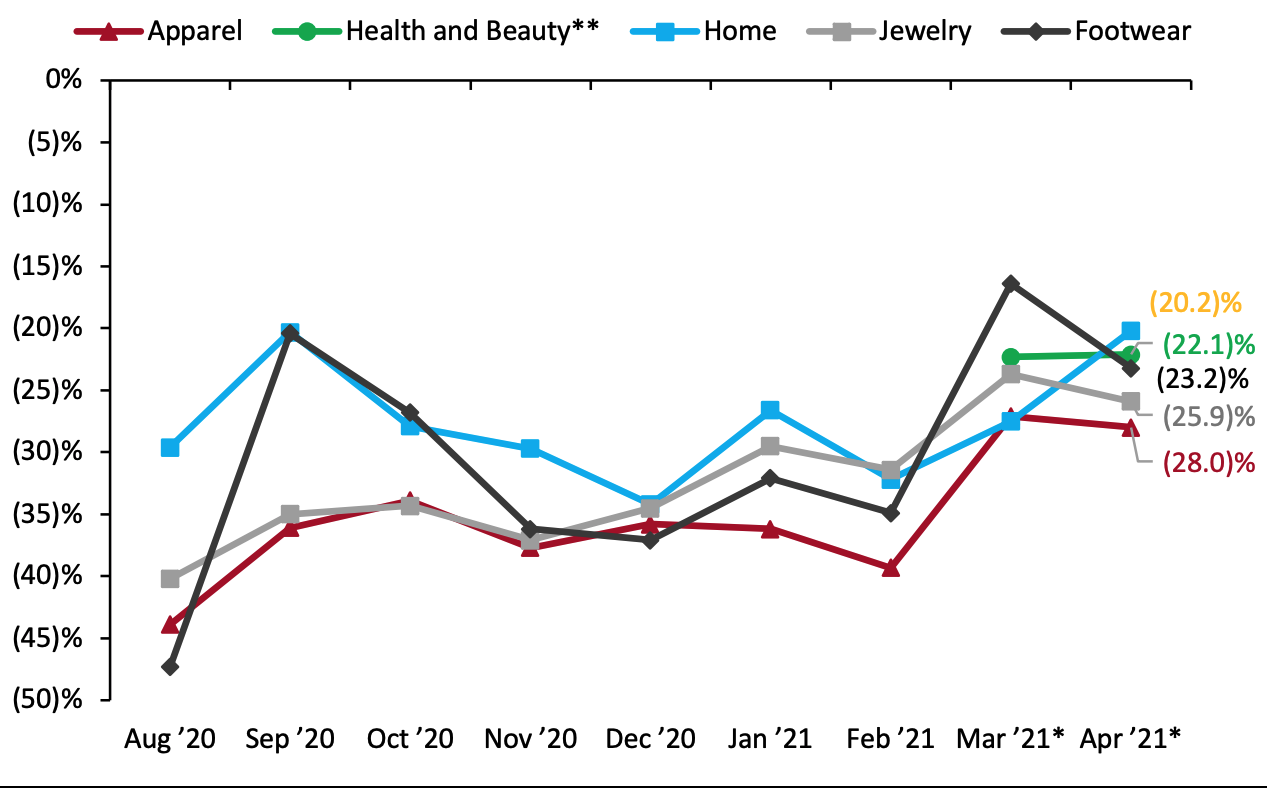 *March and April 2021 numbers are compared to 2019 as stores began closing in March 2020 due to Covid-19 and most stores were closed in April 2020.
**RetailNext started providing traffic trends for the health and beauty sector from March 2021.
Source: RetailNext[/caption] Regional Traffic Trends In April, new Covid-19 cases increased during week two, but cases began to decline in the third week and the decline continued in the fourth week of the month. By the end of April, about 40% of US adults had been fully vaccinated, but the pace of vaccination varied by region. Several states in the South and West regions had a smaller proportion of their populations receiving at least a first Covid-19 vaccine dose compared to other regions. Retail traffic in April varied across regions:
- April saw a slight weakening in traffic trends: Traffic declined by 28.4% on a two-year basis in April versus March’s 27.3% decline versus 2019. This aligns with the two-year retail sales growth of 22.2% recorded in April 2021, down from two-year growth of 26.2% in March.
- The conversion rate (sales transactions as a percentage of traffic) grew 4.6 percentage points in April, higher than March’s growth of 3.9 percentage points.
- In April, ATV (sales divided by transactions) increased by 5.2%, up from March’s 3.0% growth.
- Shopper yield (sales divided by traffic) increased by 36.2% in April, up from March’s 31.7% growth.
ATV=average transaction value; Shopper yield= Sales divided by traffic*March and April 2021 numbers are compared to 2019 as stores began closing in March 2020 due to Covid-19 and most stores were closed in April 2020.
Source: RetailNext[/caption] Weekly Shopper Traffic Trends Weekly data for April tracks the progress of store traffic over four weeks (April 4, 2021–May 1, 2021):
- Traffic performed best in the first week of April, with declines at 20.3% on a two-year basis. However, this is a deterioration from the final week of March, which saw a traffic decline of 17.4%.
- Traffic declines accelerated to 32.3% in the second week of April owing to a small spike in new Covid-19 cases and strong comparatives—in 2019, Easter fell on April 21, driving strong traffic in the second week of the month.
- Declines eased slightly to 31.8% in the third week, owing to a fall in new Covid-19 cases. Furthermore, as of April 19, individuals in the US aged 16 and above are eligible for the Covid-19 vaccine in every state.
- In the fourth week, traffic declines eased substantially to 27.1%, due to a further fall in new coronavirus cases.
- The apparel sector experienced the greatest traffic decline, at 28.0%, an increase of 90 basis points compared to March.
- The jewelry sector saw a 25.9% decrease in traffic, an increase of 220 basis points compared to March.
- The home sector posted the lowest traffic decrease at 20.2%, an improvement of 1,910 basis points compared to March.
- The health and beauty sector was the second best-performing category, with a traffic decline of 22.1%, an improvement of 20 basis points from March.
- The footwear sector posted a traffic decrease of 23.2%, an increase of 680 basis points compared to March.
*March and April 2021 numbers are compared to 2019 as stores began closing in March 2020 due to Covid-19 and most stores were closed in April 2020.**RetailNext started providing traffic trends for the health and beauty sector from March 2021.
Source: RetailNext[/caption] Regional Traffic Trends In April, new Covid-19 cases increased during week two, but cases began to decline in the third week and the decline continued in the fourth week of the month. By the end of April, about 40% of US adults had been fully vaccinated, but the pace of vaccination varied by region. Several states in the South and West regions had a smaller proportion of their populations receiving at least a first Covid-19 vaccine dose compared to other regions. Retail traffic in April varied across regions:
- The Northeast was the worst-performing region, witnessing a traffic decline of 34.5% as compared to 2019. The region saw its best traffic trends in the first week of the month, with a decline of 27.8%. In the second week of the month, the Northeast saw its worst traffic trends, with a decline of 38.5%. However, traffic trends improved in the third and fourth weeks.
- The South posted the best traffic performance for the month, with a 23.2% decline compared to 2019. This trend has continued for most of the pandemic and we expect it to continue in May as Florida’s Governor DeSantis lifted all pandemic-related restrictions in the first week of May.
- The West posted a 26.1% traffic decline for the month. The region saw its worst traffic trends in the third week of April, with a decline of 30.2%, before improving in the fourth week, with a traffic decline of 25.9%.
- The Midwest posted an overall traffic decline of 28.5%. The region saw its best traffic trends in the first week of the month, with a decline of 23.5%. In the next three weeks, the region witnessed consistent declines at an average of 30% versus 2019.
- Traffic by mall location type declined between 13% and 36%—strip malls outperformed all other location types, with a decline of only 13.4%. These locations benefited from being open-air and from the presence of nondiscretionary retailers, such as food retailers.
- Street-front/freestanding locations witnessed the largest traffic decline of around 36%, followed by luxury locations, with a decline of 33%.
- Lifestyle centers, traditional mall locations and outlet locations underperformed the national average, with declines of 30%.
- Other retail locations, including airports, casinos and hotels, reported a traffic decline of more than 28%. Many of these locations are situated in destination areas and were impacted by lower foot traffic in tourist areas owing to travel restrictions, as well as consumers avoiding such areas amid the pandemic.