Nitheesh NH
What’s the Story?
In our Leading Indicators of US Retail Sales monthly series, we examine several key macroeconomic indicators of US retail sales and analyze how they may impact the industry in the months to come. We analyze the latest available data, as of the end of April 2021, from sources such as the US Census Bureau, the US Bureau of Economic Analysts (BEA), the US Bureau of Labor Statistics (BLS) and the US Department of Housing and Urban Development (HUD).Why It Matters
Macroeconomic indicators have a significant impact on overall retail sales growth. Looking at 10 indicators (unemployment rate, labor force participation rate, disposable income per capita, average hourly raises, consumer sentiment, savings rate, gas price, interest rate, housing starts and housing prices), we can historically account for a majority of the variation in retail sales growth and create a strong basis for predicting sales moving forward. The close correlation between retail sales growth predictions based on economic indicators and actual retail sales growth is shown in Figure 1. Figure 1. US Actual Retail Sales ex. Auto and Gas Sales vs. Model Predicted Sales, January 2000–January 2021 (YoY % Change) [caption id="attachment_127137" align="aligncenter" width="720"]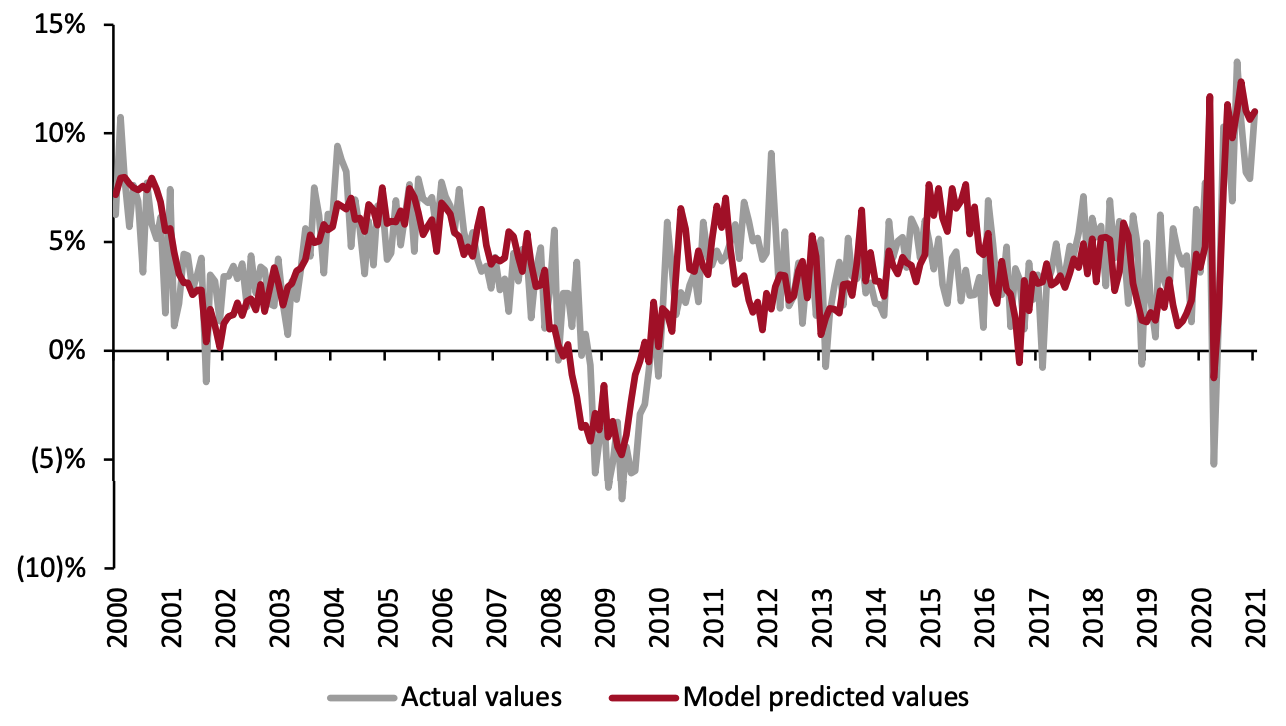 Source: BEA/BLS/Federal Reserve Board of Governors /S&P/Coresight Research[/caption]
In March, a third round of government stimulus drove a very strong month of retail sales, following a weaker February hindered by harsh weather and rising Covid-19 cases. As Covid-19 cases decrease, a growing portion of the country is some combination of fatigued by virus restrictions, immune to some extent through previous infection, or vaccinated against Covid-19. Although some experts are now skeptical if the US will be able to reach a threshold of herd immunity, the virus is likely to continue to abate, and impatient consumers are likely to be more aggressive with their out of the home activities regardless of the health situation. In light of these health and behavioral trends, we examine major macroeconomic indicators to outline what the coming months in sales will look like.
Source: BEA/BLS/Federal Reserve Board of Governors /S&P/Coresight Research[/caption]
In March, a third round of government stimulus drove a very strong month of retail sales, following a weaker February hindered by harsh weather and rising Covid-19 cases. As Covid-19 cases decrease, a growing portion of the country is some combination of fatigued by virus restrictions, immune to some extent through previous infection, or vaccinated against Covid-19. Although some experts are now skeptical if the US will be able to reach a threshold of herd immunity, the virus is likely to continue to abate, and impatient consumers are likely to be more aggressive with their out of the home activities regardless of the health situation. In light of these health and behavioral trends, we examine major macroeconomic indicators to outline what the coming months in sales will look like.
Leading Indicators of US Retail Sales: In Detail
Indicators Overview Of the 10 indicators we examined, six are likely to have a positive impact on retail sales in the coming months. Although April’s jobs report was disappointing and stalled what was expected to be an accelerating labor market recovery, a sharp rise in consumer sentiment, resurgent housing market, and rise in wages and disposable income are likely to keep retail sales strong. Figure 2. US: Leading Indicators of Retail Sales, as of the End of April 2021 [caption id="attachment_127139" align="aligncenter" width="720"]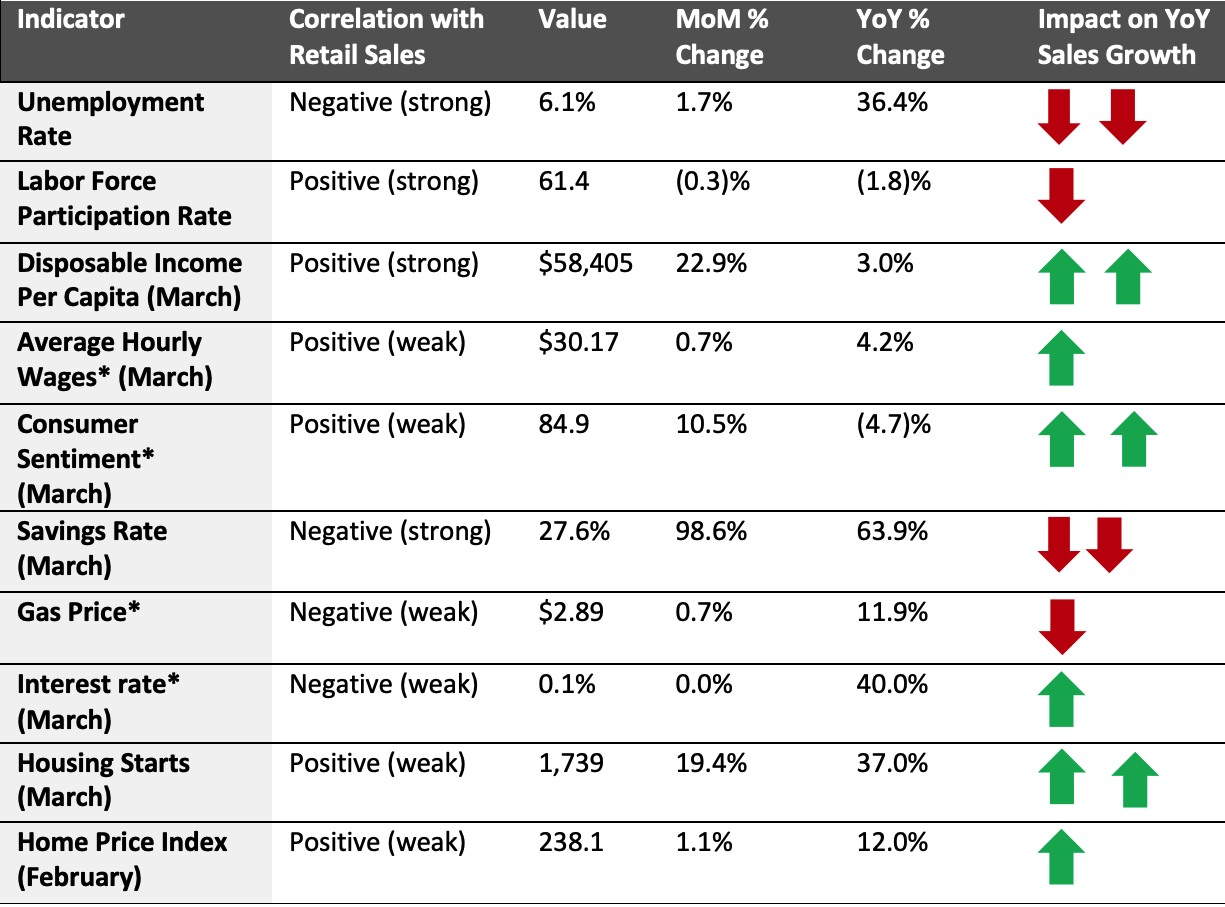 Latest available data from April unless otherwise indicated
*Not included in predictive model
Source: BEA/BLS/Federal Reserve Board of Governors /S&P/University of Michigan/US Energy
Information Administration/Coresight Research[/caption] Looking ahead to yet-to-be-reported April sales and projected sales in May, we predict that retail sales will increase by 18.5% year over year, as illustrated in Figure 3. This strong growth is driven in part by the major dip in retail sales in April 2020. Nevertheless, even compared to 2019 levels, we anticipate a solid performance of 17.2% growth. Figure 3. US Retail Sales ex. Auto and Gas (YoY % Change)* [caption id="attachment_127141" align="aligncenter" width="720"]
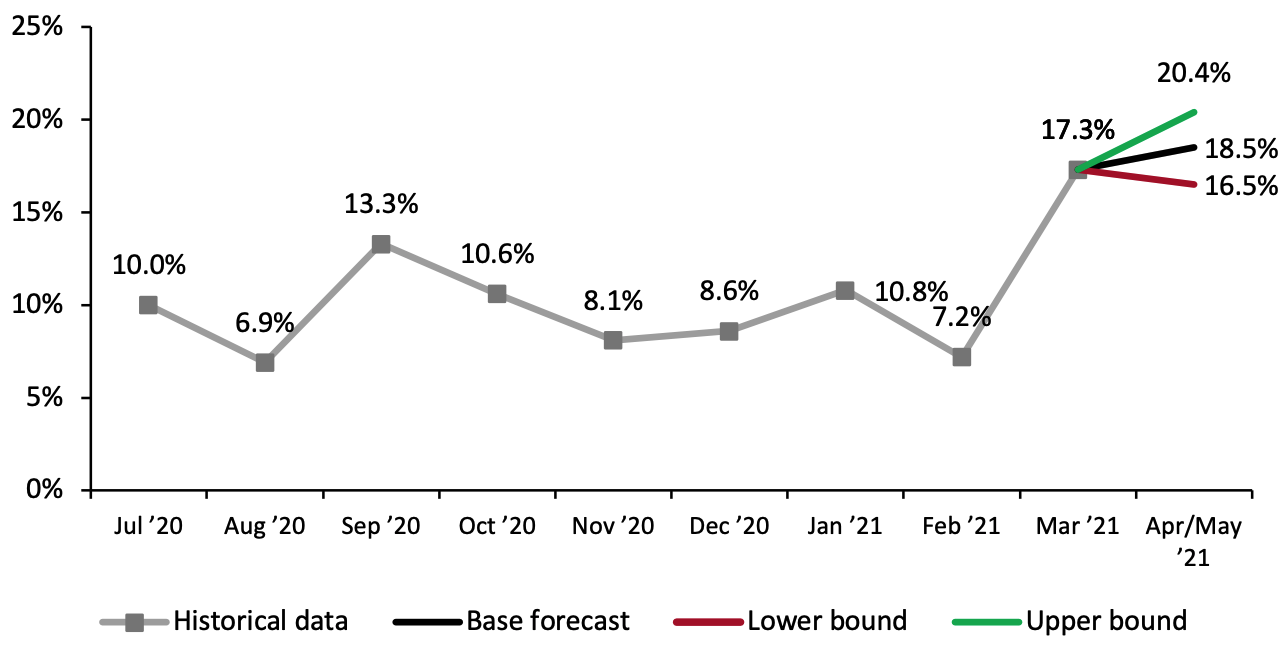 *This month’s prediction uses February disposable income per capita and savings rates due to the stimulus-driven artificially high figures for these variables in March
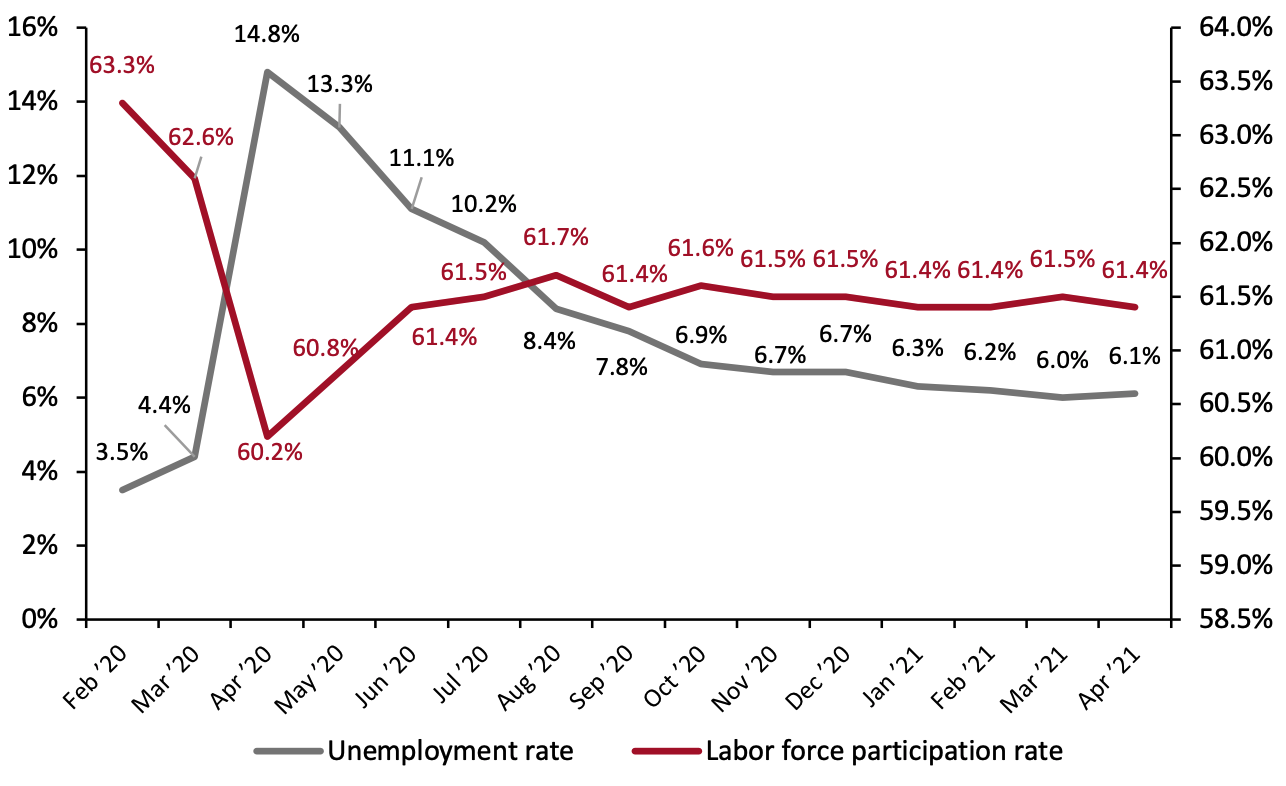
Source: BEA/BLS/Federal Reserve Board of Governors /S&P/Coresight Research[/caption] The Job Market The job market recovered at a much slower rate than expected in April, with the unemployment rate rising just slightly and the labor force participation rate ticking down. Forecasters generally expected falling Covid-19 cases and widespread reopenings to spark a job boom beginning in April, but a confluence of other factors appeared to have overwhelmed the pandemic recovery and kept employment numbers low. Continued generous unemployment benefits likely continue to impact the decisions that low-income consumers make in terms of their employment. Furthermore, the manufacturing sector in the US has begun to struggle recently due to a shortage of chips used in electronic devices, cars and other equipment. The Alliance for American Manufacturing reported that supply chain issues in April, highlighted by the shortage of semiconductors, caused the loss of 18,000 jobs—concentrated in auto manufacturing. Despite these issues, April’s slight uptick in unemployment is almost certainly a bump in the road rather than a reversion of the anticipated labor market recovery. As we move toward the summer, virus cases are likely to continue to decline and even the most cautious states are expected to lift virus-related restrictions. This should spark a drastic increase in spending on services, creating jobs for workers who were hit hardest by the initial pandemic-related closures. After stalling in the late fall and early winter, job market recovery appears to be back on track. The unemployment rate decreased to 6.0% in March 2021, still far above pre-pandemic levels but continuing to edge closer to normalcy. Figure 4. US Unemployment Rate (Left Axis, %) and Labor Force Participation Rate (Right Axis, %) [caption id="attachment_127142" align="aligncenter" width="720"]
 Source: BLS[/caption]
Average hourly wages across all private-sector employees rose this month to a high of $30.17, surpassing the previous record set in April 2020 at the start of the pandemic. Unlike that spike in April 2020, which was driven by the disproportionate job losses among low-income workers, this rise appears to be a genuine increase in wages for workers who are currently employed. While this rise is a positive sign for retail sales, a continued rise at the rate we have seen over the past several months could elevate fears of inflation.
Figure 5. US Average Hourly Wages, All Private-Sector Employees (USD)
[caption id="attachment_127143" align="aligncenter" width="720"]
Source: BLS[/caption]
Average hourly wages across all private-sector employees rose this month to a high of $30.17, surpassing the previous record set in April 2020 at the start of the pandemic. Unlike that spike in April 2020, which was driven by the disproportionate job losses among low-income workers, this rise appears to be a genuine increase in wages for workers who are currently employed. While this rise is a positive sign for retail sales, a continued rise at the rate we have seen over the past several months could elevate fears of inflation.
Figure 5. US Average Hourly Wages, All Private-Sector Employees (USD)
[caption id="attachment_127143" align="aligncenter" width="720"]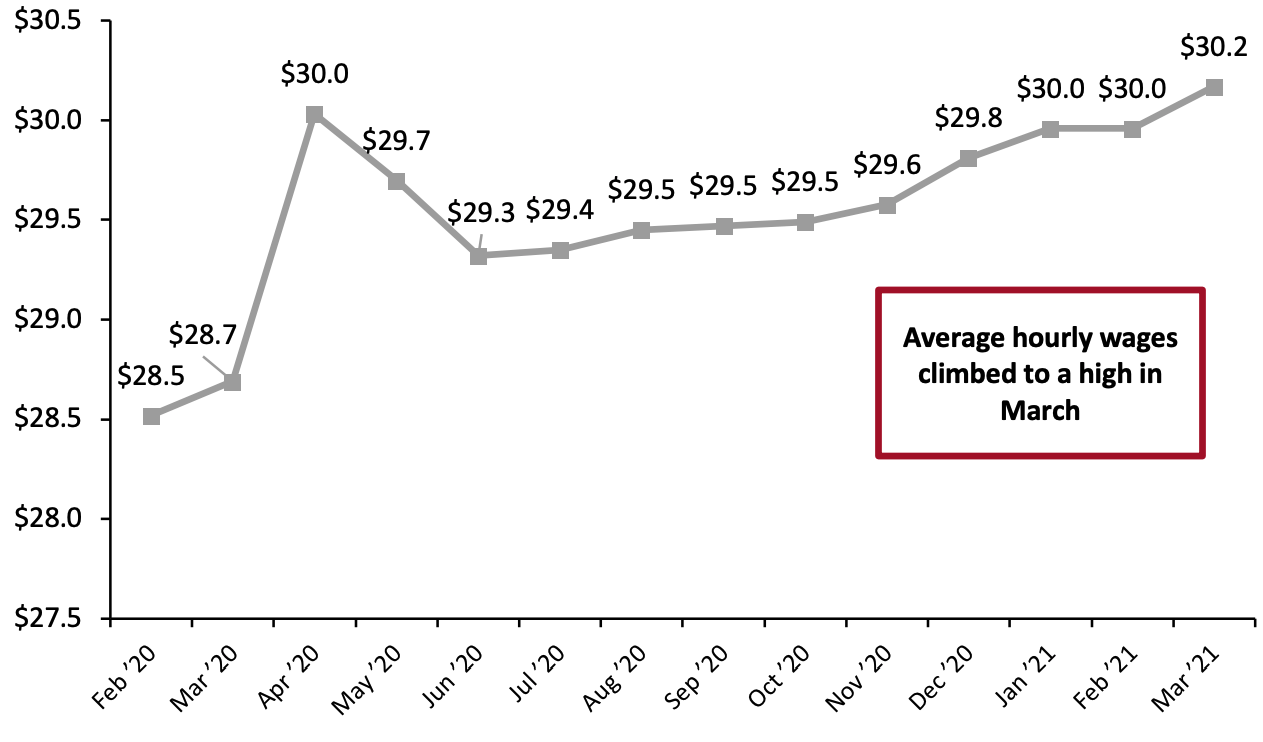 Source: BLS[/caption]
Implications
Paradoxically, following the disappointing April jobs report, stocks rose in the US, buoyed by a belief that the slowdown would encourage the Federal Reserve to keep interest rates low for the foreseeable future. While that has helped investors perform well, the stall in recovery just as cases in the US plummeted in and the vaccine roll-out increased rapidly hints at a recovery that might be slightly slower than anticipated. South Carolina and Montana have now canceled federal pandemic unemployment benefits citing labor shortages in the state, and consumers across the nation appear less eager to go back to work than we might have initially expected. Nonetheless, the overall economic recovery is almost certain to remain strong despite this temporary bump in the road. Retailers can still expect consumers, whose wages are rising and who in coming months are likely to get back to work, to spend well in the coming months.
Income, Savings and Sentiment
As expected, disposable income in March shot up to a high of $58,405, buoyed by the issuance of a third and final round of direct stimulus to consumers. This jump in disposable income is not a true indicator of the long-term income that US consumers have—this figure is likely to drop closer to $48,000 in the coming months.
Figure 6. US Annualized Real Disposable Income Per Capita (USD)
[caption id="attachment_127144" align="aligncenter" width="720"]
Source: BLS[/caption]
Implications
Paradoxically, following the disappointing April jobs report, stocks rose in the US, buoyed by a belief that the slowdown would encourage the Federal Reserve to keep interest rates low for the foreseeable future. While that has helped investors perform well, the stall in recovery just as cases in the US plummeted in and the vaccine roll-out increased rapidly hints at a recovery that might be slightly slower than anticipated. South Carolina and Montana have now canceled federal pandemic unemployment benefits citing labor shortages in the state, and consumers across the nation appear less eager to go back to work than we might have initially expected. Nonetheless, the overall economic recovery is almost certain to remain strong despite this temporary bump in the road. Retailers can still expect consumers, whose wages are rising and who in coming months are likely to get back to work, to spend well in the coming months.
Income, Savings and Sentiment
As expected, disposable income in March shot up to a high of $58,405, buoyed by the issuance of a third and final round of direct stimulus to consumers. This jump in disposable income is not a true indicator of the long-term income that US consumers have—this figure is likely to drop closer to $48,000 in the coming months.
Figure 6. US Annualized Real Disposable Income Per Capita (USD)
[caption id="attachment_127144" align="aligncenter" width="720"]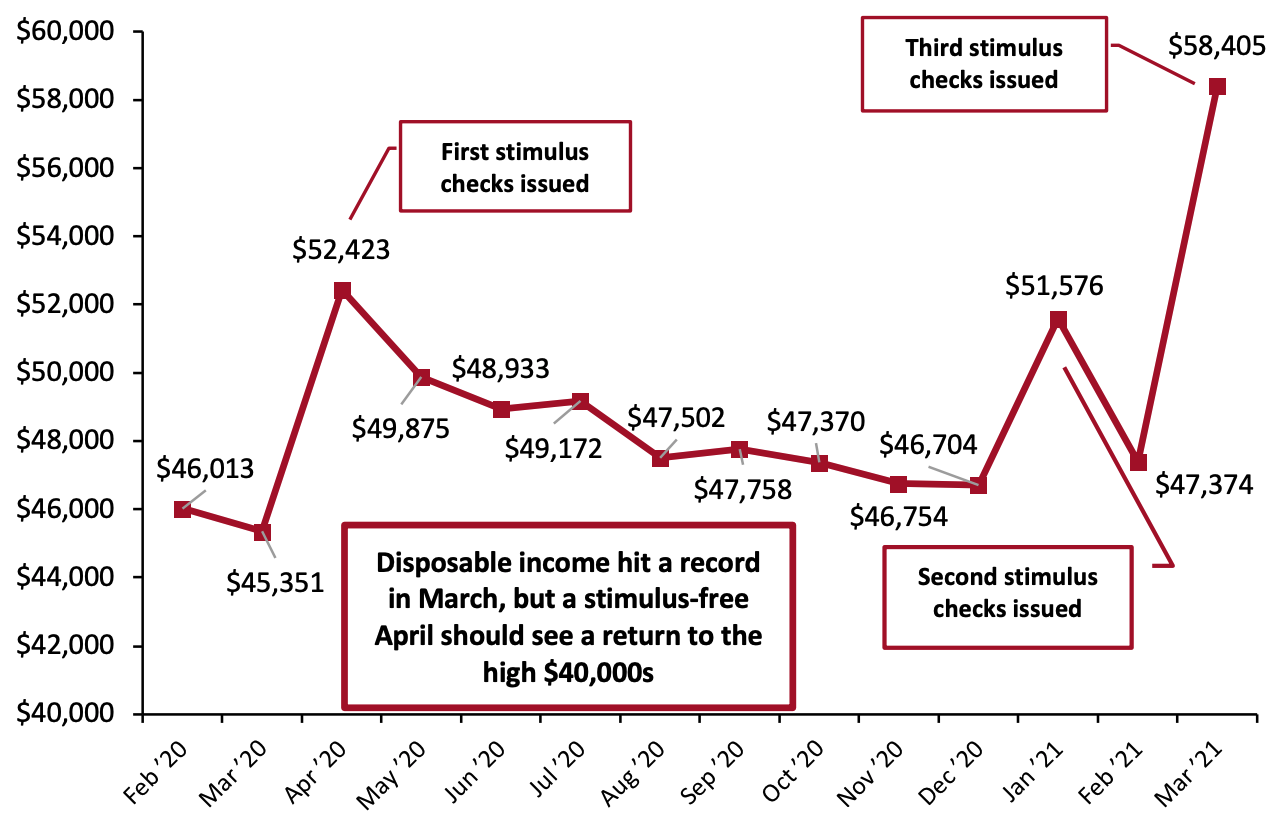 Source: BEA[/caption]
Corresponding to this hike in disposable income was a jump in the personal savings rate, which climbed to 27.6%, more than double its value from the prior month and the closest the rate has come to its high of 33.7% in April 2020. Again, this rate is likely to drop to a level closer to 13%, where it has sat in recent months that have not seen direct government payments to consumers.
A 13% rate of savings is still far higher than pre-pandemic levels, and indicates that consumers are still reining in spending. However, this conservative attitude toward spending is likely to fade in the coming months, as virus restrictions are eased across the US and consumers become more comfortable with activities outside of their houses.
Figure 7. Personal Savings Rate (%)
[caption id="attachment_127145" align="aligncenter" width="720"]
Source: BEA[/caption]
Corresponding to this hike in disposable income was a jump in the personal savings rate, which climbed to 27.6%, more than double its value from the prior month and the closest the rate has come to its high of 33.7% in April 2020. Again, this rate is likely to drop to a level closer to 13%, where it has sat in recent months that have not seen direct government payments to consumers.
A 13% rate of savings is still far higher than pre-pandemic levels, and indicates that consumers are still reining in spending. However, this conservative attitude toward spending is likely to fade in the coming months, as virus restrictions are eased across the US and consumers become more comfortable with activities outside of their houses.
Figure 7. Personal Savings Rate (%)
[caption id="attachment_127145" align="aligncenter" width="720"]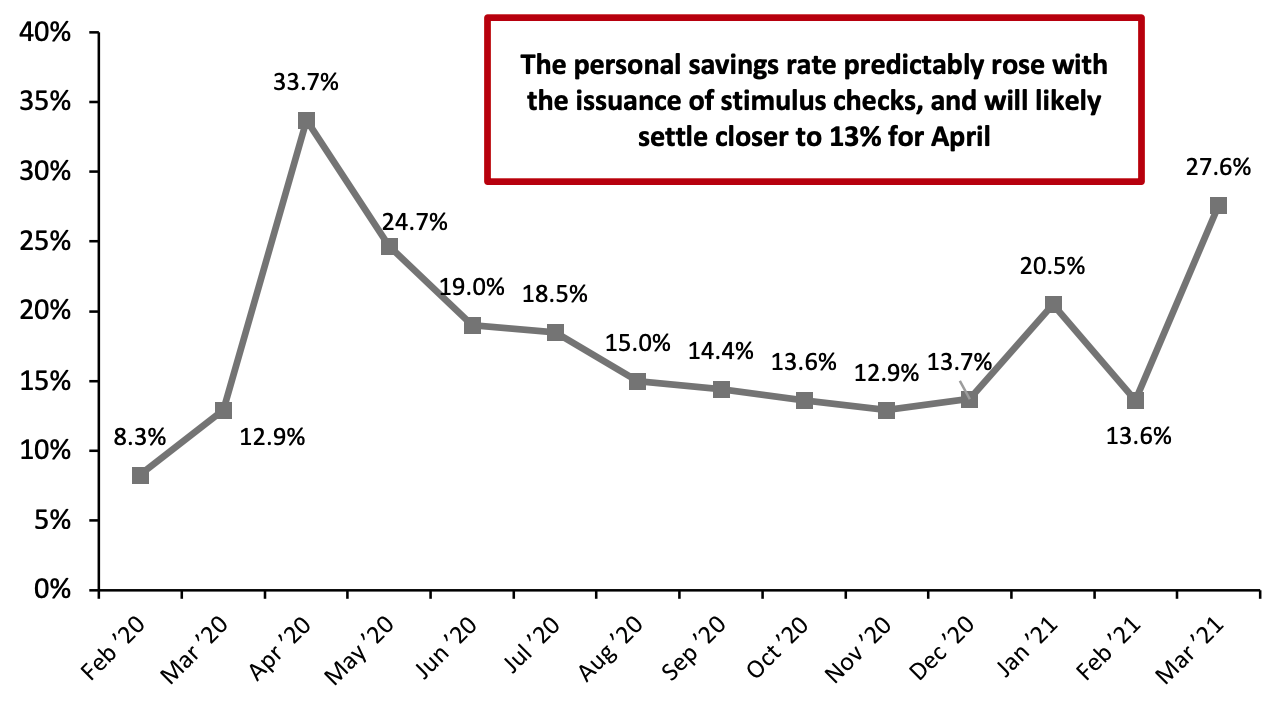 Source: BEA[/caption]
Consumer confidence rose sharply in March this year to its highest value since March 2020, indicative of a more optimistic attitude among consumers toward the pandemic in the US. The movement of this metric has largely tracked with changes in Covid-19 caseloads: sentiment dropped to its lowest value during the first wave of infections in April and recovered in late spring when cases dropped. The same pattern emerged over the summer when sentiment plummeted in July but bounced back in the fall in accordance with caseload changes. We likely saw the final virus-related dip in sentiment in January and February, when sentiment fell nearly four percentage points from December as the US infection rates rose. With cases unlikely to bounce back to anything near the levels seen this winter, we expect consumer sentiment is to stay at a higher rate than the previous 12 months.
Figure 8. University of Michigan Consumer Sentiment Index
[caption id="attachment_127146" align="aligncenter" width="720"]
Source: BEA[/caption]
Consumer confidence rose sharply in March this year to its highest value since March 2020, indicative of a more optimistic attitude among consumers toward the pandemic in the US. The movement of this metric has largely tracked with changes in Covid-19 caseloads: sentiment dropped to its lowest value during the first wave of infections in April and recovered in late spring when cases dropped. The same pattern emerged over the summer when sentiment plummeted in July but bounced back in the fall in accordance with caseload changes. We likely saw the final virus-related dip in sentiment in January and February, when sentiment fell nearly four percentage points from December as the US infection rates rose. With cases unlikely to bounce back to anything near the levels seen this winter, we expect consumer sentiment is to stay at a higher rate than the previous 12 months.
Figure 8. University of Michigan Consumer Sentiment Index
[caption id="attachment_127146" align="aligncenter" width="720"]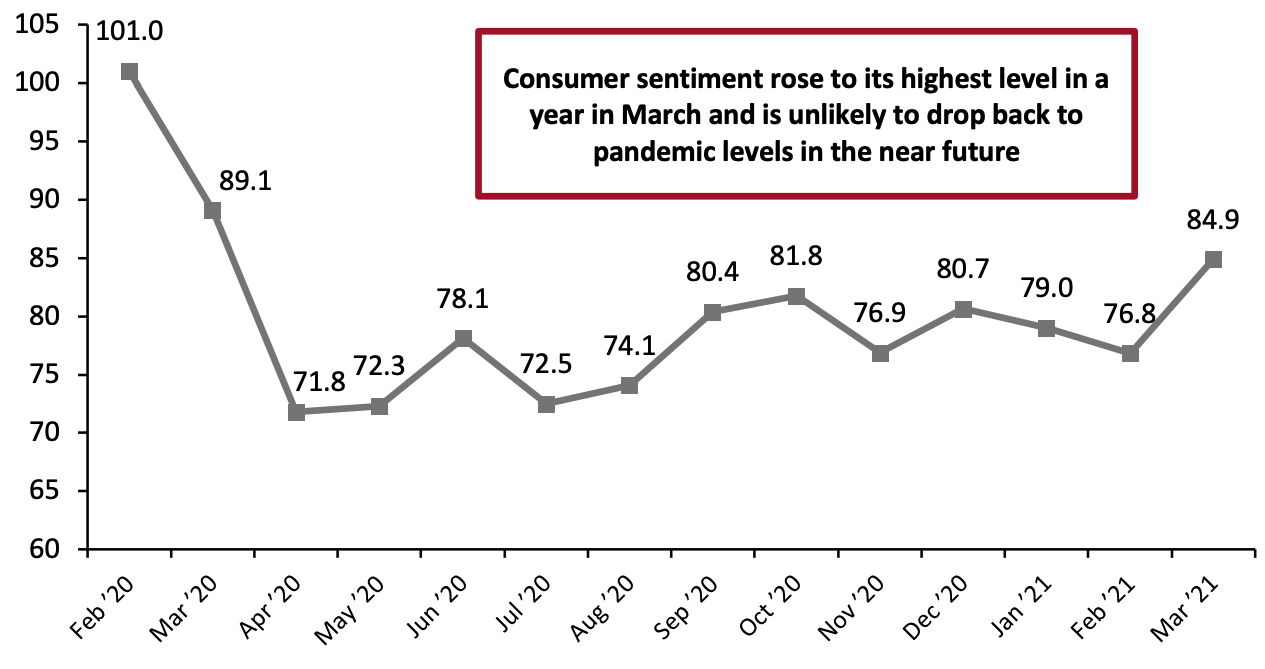 Source: University of Michigan[/caption]
However, global supply chain challenges and other geopolitical issues could still put a dent in the confidence of consumers who are more aware than ever of the fragility of the interconnected world they live in. In March, a container ship blocked the Suez Canal, sending shockwaves through the world that continue to impact the economy—in part by elevating the price of gas even through April.
Figure 9. US Regular All Formulations Gas Price (Dollars per Gallon)
[caption id="attachment_127147" align="aligncenter" width="720"]
Source: University of Michigan[/caption]
However, global supply chain challenges and other geopolitical issues could still put a dent in the confidence of consumers who are more aware than ever of the fragility of the interconnected world they live in. In March, a container ship blocked the Suez Canal, sending shockwaves through the world that continue to impact the economy—in part by elevating the price of gas even through April.
Figure 9. US Regular All Formulations Gas Price (Dollars per Gallon)
[caption id="attachment_127147" align="aligncenter" width="720"]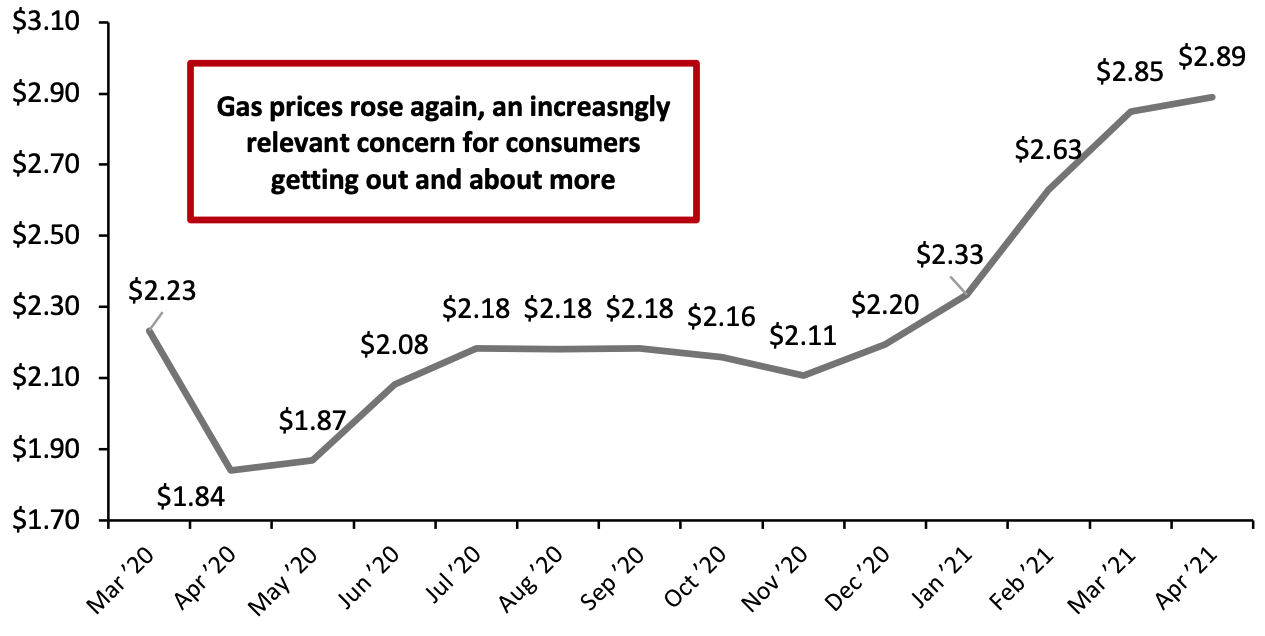 Source: US Energy Information Administration[/caption]
More recently, other disruptions to the global economy have provided further cause for concern to consumers and retailers alike. A cyber attack on a major gas line in the US again called into question the resilience of major global infrastructure, while a chip shortage is threatening many manufacturers’ ability to produce the vast array of goods that now rely on microchips.
Implications
A continually high savings rate has given consumers a nearly unprecedented amount of pent-up spending power. In the short term, it may also be something of a saving grace: without a very high savings rate, the stimulus injected into the economy over the past several months would likely have driven a much more immediate burst of inflation. As it stands, inflation will be something to watch moving forward, but with the current velocity of money being so low, it will take a more sustained period of frequent spending to trigger a concerning level of inflation. Such spending may be near in our future: consumer sentiment is likely to remain high moving forward, sparking continued strong retail spending and supporting a surge in service spending.
Separately, a rise in gas prices could become a much larger issue this summer. We expect consumers to get back to commuting and traveling this summer, often by car rather than plane, which will heighten the relevance of gas price increases on consumer spending in other categories.
Housing
Following two months of slowdown, housing starts accelerated in March to their highest rate since the start of the pandemic, while home prices continued their upward trend—setting another record in February at 238.8.
Figure 10. Housing Starts (Thousands, Left Axis) and Case-Shiller US Home Price Index (Right Axis)
[caption id="attachment_127148" align="aligncenter" width="720"]
Source: US Energy Information Administration[/caption]
More recently, other disruptions to the global economy have provided further cause for concern to consumers and retailers alike. A cyber attack on a major gas line in the US again called into question the resilience of major global infrastructure, while a chip shortage is threatening many manufacturers’ ability to produce the vast array of goods that now rely on microchips.
Implications
A continually high savings rate has given consumers a nearly unprecedented amount of pent-up spending power. In the short term, it may also be something of a saving grace: without a very high savings rate, the stimulus injected into the economy over the past several months would likely have driven a much more immediate burst of inflation. As it stands, inflation will be something to watch moving forward, but with the current velocity of money being so low, it will take a more sustained period of frequent spending to trigger a concerning level of inflation. Such spending may be near in our future: consumer sentiment is likely to remain high moving forward, sparking continued strong retail spending and supporting a surge in service spending.
Separately, a rise in gas prices could become a much larger issue this summer. We expect consumers to get back to commuting and traveling this summer, often by car rather than plane, which will heighten the relevance of gas price increases on consumer spending in other categories.
Housing
Following two months of slowdown, housing starts accelerated in March to their highest rate since the start of the pandemic, while home prices continued their upward trend—setting another record in February at 238.8.
Figure 10. Housing Starts (Thousands, Left Axis) and Case-Shiller US Home Price Index (Right Axis)
[caption id="attachment_127148" align="aligncenter" width="720"]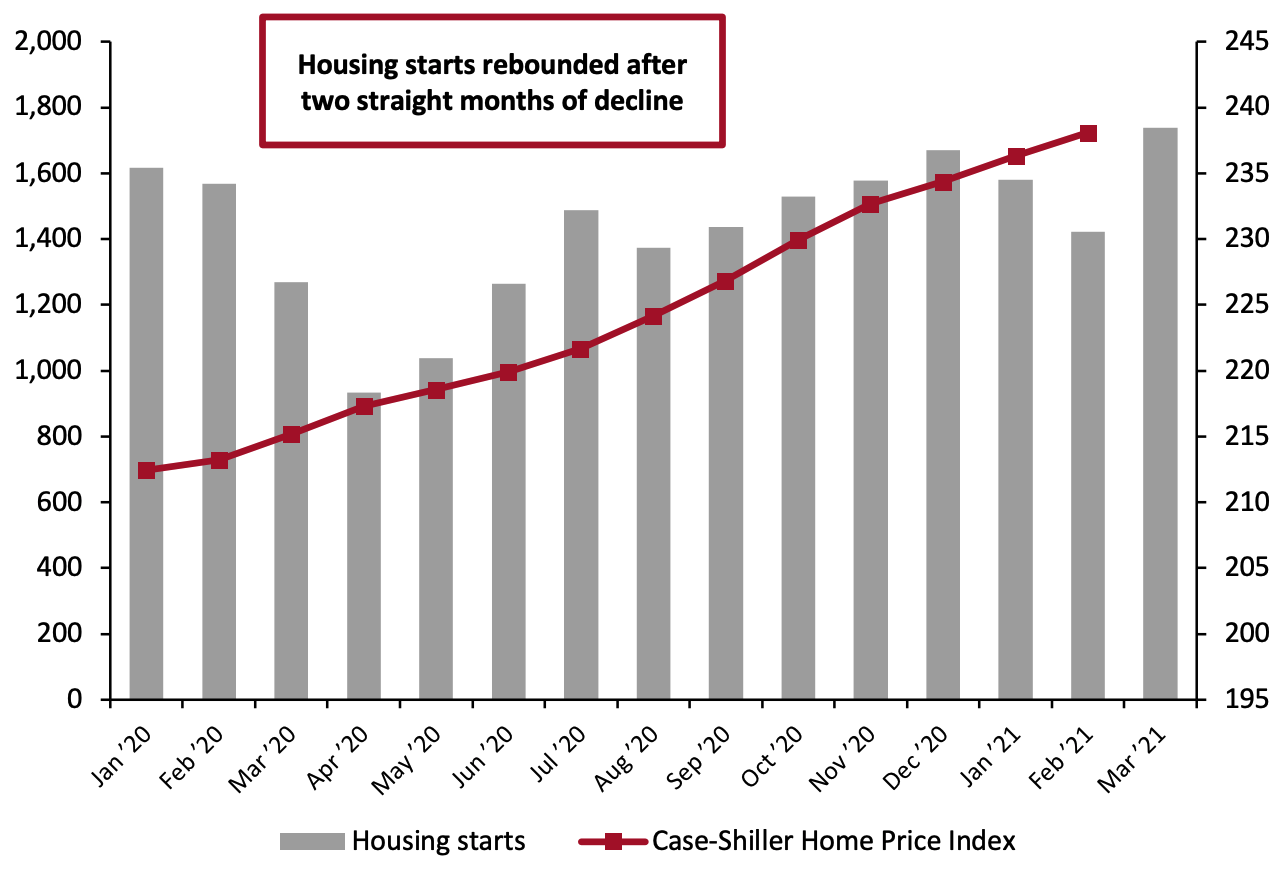 Source: HUD/US Census Bureau[/caption]
The Federal Reserve is set to keep interest rates low for the near future, which should continue to encourage home buying. Fears of inflation could also drive a surge in home buying, as consumers look for inflation-proof assets.
Implications
Home prices have not just been rising—they have been rising at an accelerating pace. That on its own might be concerning if the reasons for the rise were not so clear cut and temporary. Low mortgage rates have encouraged more people to buy homes, but mortgage rates have already begun to climb somewhat, even as the Federal Funds Rate (what we define as the interest rate in these reports) remains low. The result is a drastic reduction in mortgage applications that indicates a likely decline in housing starts and a slowdown in price increases in the coming months. Furthermore, flight from cities during the pandemic boosted demand for and resulting prices in suburban areas. While city real estate did see prices suffer somewhat, this resulted in an overall national rise in prices.
Slowing housing starts, combined with consumers getting out of the house more, should finally slow the growth of the home-improvement sector, which has thrived during the pandemic. The continued rise in house prices will likely embolden homeowning consumers to spend more across categories, as the value of their assets increases and they perceive themselves as wealthier.
Source: HUD/US Census Bureau[/caption]
The Federal Reserve is set to keep interest rates low for the near future, which should continue to encourage home buying. Fears of inflation could also drive a surge in home buying, as consumers look for inflation-proof assets.
Implications
Home prices have not just been rising—they have been rising at an accelerating pace. That on its own might be concerning if the reasons for the rise were not so clear cut and temporary. Low mortgage rates have encouraged more people to buy homes, but mortgage rates have already begun to climb somewhat, even as the Federal Funds Rate (what we define as the interest rate in these reports) remains low. The result is a drastic reduction in mortgage applications that indicates a likely decline in housing starts and a slowdown in price increases in the coming months. Furthermore, flight from cities during the pandemic boosted demand for and resulting prices in suburban areas. While city real estate did see prices suffer somewhat, this resulted in an overall national rise in prices.
Slowing housing starts, combined with consumers getting out of the house more, should finally slow the growth of the home-improvement sector, which has thrived during the pandemic. The continued rise in house prices will likely embolden homeowning consumers to spend more across categories, as the value of their assets increases and they perceive themselves as wealthier.
What We Think
As we anticipated in the previous edition of this report, March retail sales were very strong owing to stimulus checks. April and May retail sales are again likely to be strong, with April seeing especially strong year-over-year growth due to last year’s dramatic drop in sales when the pandemic first hit the US. Implications for Brands/Retailers- Despite poor April labor market numbers, retailers should still expect a sustained increase in employment in the coming months, a trend that is likely to buoy spending among low-income workers returning to the labor force.
- Retailers must start taking note of the continued rise in wages seen over the past nine months. Some consumers who can still reap the benefits of pandemic-related government programs may be less incentivized to return to work, boosting the minimum wages needed to draw them back into the labor force. Combined with the potential for inflation, retailers may be looking at a substantial rise in labor costs in the mid-term future.
- Consumer confidence is unlikely to return to the low values it hovered around over the past year, suggesting that consumers will begin unloading some of their pent-up spending power across a diverse array of goods and services in the very near future.