DIpil Das
[caption id="attachment_87578" align="aligncenter" width="720"]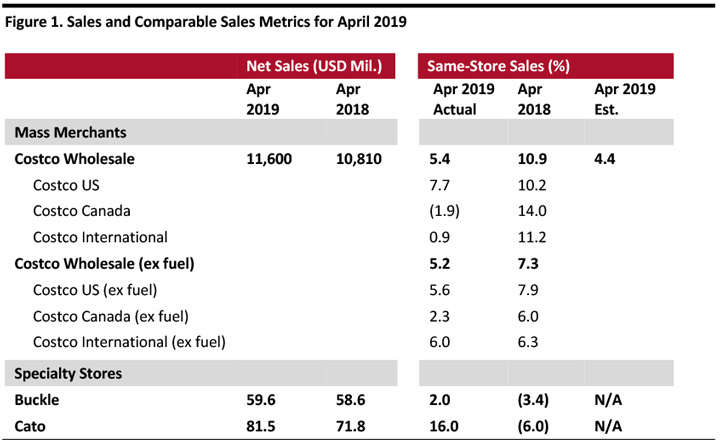 Source: Company reports/StreetAccount[/caption]
Costco Comps Beat Consensus, E-Commerce Comparable Sales Growth Accelerates
Source: Company reports/StreetAccount[/caption]
Costco Comps Beat Consensus, E-Commerce Comparable Sales Growth Accelerates
Source: Company reports/StreetAccount[/caption]
Costco Comps Beat Consensus, E-Commerce Comparable Sales Growth Accelerates
- In April, Costco grew same-store sales 5.4% year over year, slightly slower than the 5.7% growth in March, but ahead of the consensus estimate recorded by StreetAccount.
- The company said this year’s April had one less shopping day than last year, due to the calendar shift of Easter, which negatively impacted total sales and comparable sales by approximately 1.5% to 2%.
- Costco’s e-commerce comparable sales were up 23.6% in April, faster than March’s 20.6% growth.
- In April, comparable traffic at Costco was up 3.5% in the US and 3.3% worldwide, including the negative impact from Easter shift.
- The retailer’s strongest results in the US were in the Midwest, Los Angeles and San Diego. In terms of international performance, the company saw results in Japan, Spain, Mexico and Taiwan.
- Foreign currency fluctuations negatively impacted the company’s comps. Canada was hurt by about 500 basis points, while international comp sales were negatively impacted by approximately 510 basis points. Overall, the company was negatively impacted by 140 basis points.
- Cannibalization negatively impacted the US by about 50 basis points, Canada by 70 basis points and other international segments by approximately 90 basis points. Overall, the company was negatively impacted by 60 basis points.
- Revenue recognition standard ASC 606 had a positive impact of approximately 130 basis points for the US and 100 basis points for the total company.
- In the merchandise segment, excluding the impact of forex, comps for food and sundries were positive mid-single digits. Candy, deli and liquor showed the strongest results.
- Hardlines posted comps in the mid-single digits: Toys, seasonal, majors and HABA saw especially good performance.
- Softlines were up mid-single digits: Home furnishings, kiosk and housewares showed strong performance.
- Fresh food comparable sales were up mid-single digits, with service, deli and meat being better-performing departments.
- In the ancillary businesses, hearing aids, gasoline and optical had the best comp sales increases.
- Gasoline price inflation positively impacted total comps by 60 basis points. The overall average selling price increased 4.7% year over year to $3.14 per gallon this year compared to $3.0 a year earlier.
- Buckle’s comparable sales increased 2.0% year over year in April, compared to a 0.5% increase reported in March. Net sales grew 1.7% year over year, compared to flat sales in March.
- Total sales in men’s were up 5.5% year over year and the segment accounted for approximately 51.5% of total sales in April 2019. Price points were down about 4.5% for April in men’s.
- Total sales in the women’s segment fell 1.5% year over year. The women’s segment accounted for 48.5% of total monthly sales in April 2019. Price points were down about 5.0%.
- Accessories sales grew 4.0% year over year in April and accounted for 9.0% of total sales. Footwear sales grew 13.0% year over year and represented 8.0% of total sales. Average accessory price points were down by about 10.0% and average footwear price points were flat in April.
- In April, units per transaction grew 4.0% and the average transaction value decreased about 0.5%.
- Cato’s sales increased 13.5% year over year to $81.5 million, compared to a 9.8% decline in March. Comparable sales grew 16.0% year over year in April, compared to a 7.0% decline in March.
- Cato noted that April sales were positively impacted by the shift of Easter from March last year to April this year.
- As of May 4, 2019, the company owned 1,302 stores in 31 states, compared to 1,351 stores in 33 states as of May 5, 2018.