Web Developers
Costco’s April Comp Sales Lifted by One Additional Selling Day
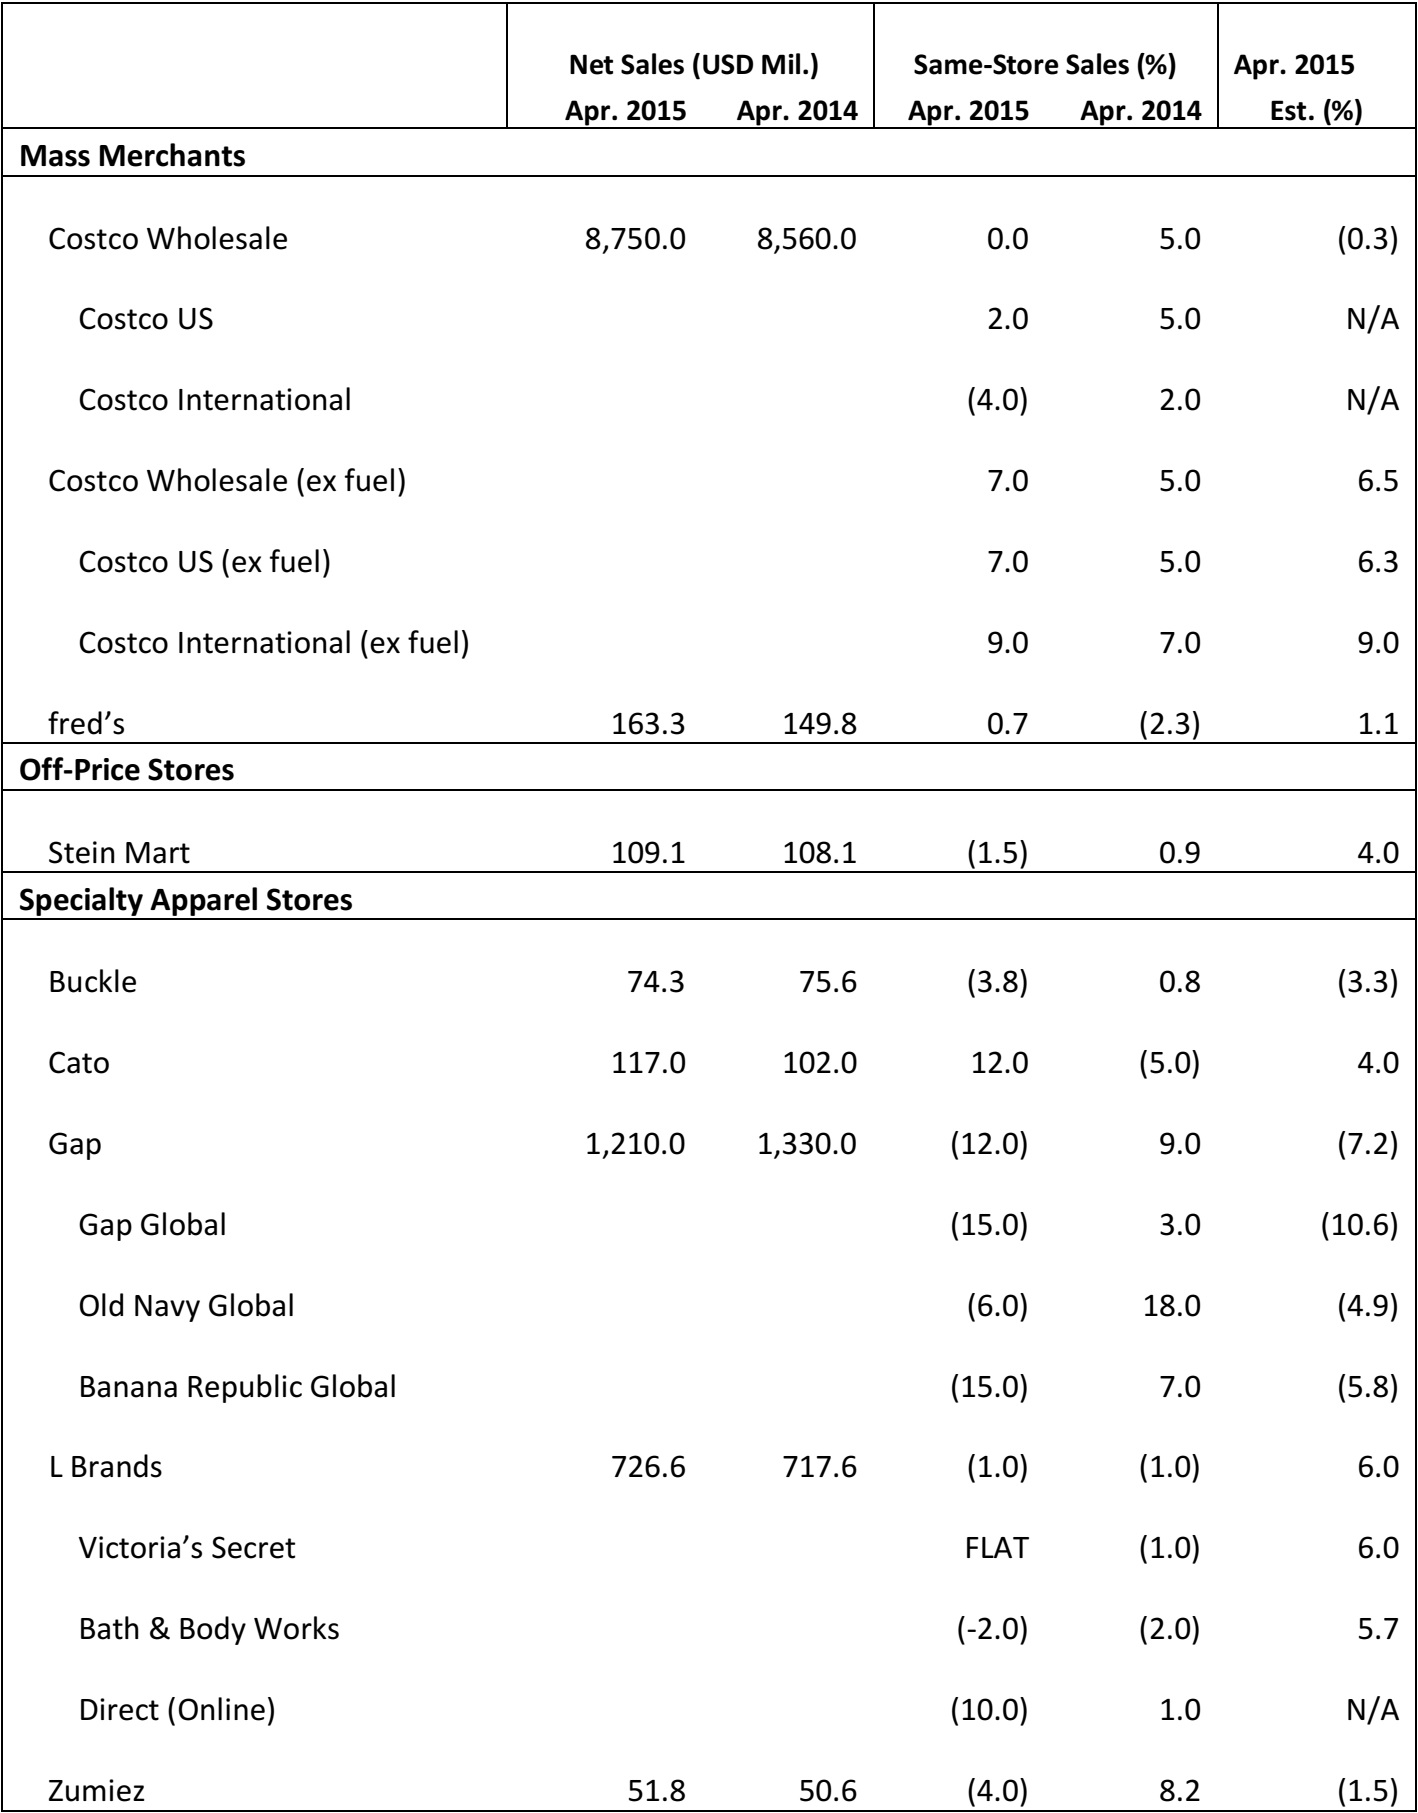
- The four-week period had 28 selling days this year versus 27 selling days last year, reflecting the earlier timing of the Easter holiday. The calendar shift improved this year’s net and comparable sales by 1.5%–2.0%.
- Costco’s flat comparable sales number was higher than the 0.3% decline that analysts had estimated. When excluding the impact of fuel, comp sales were up 7%.
- Within the US, the strongest sales regions were the Midwest and California. On the international side, strong sales were posted in Australia, Canada and Taiwan.
- Strong merchandise in the food department included sundries and frozen food. In hardline hardware, beauty and health equipment were the top-performing categories, posting mid-single-digit sales. Men’s apparel was one of the best-performing softline categories.
Combined March and April Sales at Value Store Fred’s Increased 5%
- April 2014 sales included $6 million from 62 stores that were closed later that year. Excluding the closed stores, the total sale would have grown at 14%, up from the reported 9%.
- With the Easter calendar shift, combined March and April sales increased 5% to $356.8 million from $340.8 million.
- During April 2015, Fred’s opened two Xpress pharmacy locations and two specialty pharmacy locations.
Popular Women’s Apparel Assortment Helped Stein Mart’s Sales in April
- As expected, the Easter calendar shift lifted March sales at the cost of April’s for Stein Mart. While sales declined 1.5%, combined March and April sales increased by 5.6%.
- Florida had the strongest sales while California, Texas and the Gulf States underperformed.
- Women’s apparel posted the strongest sales, driven by dresses and ladies’ boutique; this reflects positive response to Stein Mart’s spring assortment.
Teen Retailer Buckle’s April Sales Declined More Than March
- Buckle’s overall comps were down 3.8 %: women’s categories were weak, declining by 3%, but men’s business was up 1.5%. The average transaction volume grew by 4.5% for the four weeks.
- The women’s section accounted for 57% of total monthly sales versus 58% last year. The total sales portion for men’s categories increased to 43% from 42% last year.
- Popular men’s categories included casual bottoms, shorts and accessories. On the women’s side, woven tops were strong.
Cato’s April Total and Comp Sales Posted Double-Digit Decline
- Cato reported sales of $84.1 million for the four weeks ended May 2, 2015, down 10% from $93.5 million in 2014.
- Combined March and April same-store sales were flat on a YoY basis.
Gap Inc. Business Affected by Strengthening US Dollar
- Gap’s April comp sales were down 12%. The strong US dollar affected the overall business by about $90 million in 1Q 2015, primarily from the weakening Japanese yen and Canadian dollar. On a constant currency basis, net sales were down 1%.
- The total net sales for April were $1.21 billion for the four weeks, down from $1.33 billion last year.
- Old Navy posted the smallest loss among all Gap brands, at -6%.
L Brands Reports -1% April Comp Reflecting Early Easter; 1Q Comp Rose 5% and EPS Guidance Raised
- The early Easter negatively impacted L Brands comps by about five points. The company looked for April sales to be flat, but they came in marginally better, up 1%.
- Comps were flat at Victoria’s Secret and down 2% at Bath & Body Works. Direct sales at Victoria’s Secret declined 10%, as significant growth in core categories was more than offset by the exit of apparel.
- 1Q comps increased 5%, reflecting a 5% 1Q comp at Victoria’s Secret and a 4% 1Q comp at Bath & Body Works. Merchandise margins are up 1Q15/1Q14 in tandem with trends at Victoria’s Secret. Inventories are down 7% per square foot YoY, boding well for early 2Q selling.
Zumiez 4.0 % April Comp Sales Decline Driven by Decreasing Comparable Transaction Volume
- The decrease in Zumiez comps was driven by declining comparable transaction volumes but offset by increase in dollar-per-transaction figures.
- Footwear, men’s, juniors and accessories had negative comps while hard goods posted positive results.
- For March and April combined, comps sales increase by 1.4% YoY, versus 1.7% YoY in 2014.