
Nitheesh NH
Introduction: Reshaping Physical Retail
We are at a turning point for the US shopping mall. As shopper traffic continues to slide and struggling retailers shutter thousands of stores, unexceptional midmarket shopping malls face a self-perpetuating downward spiral of declining shopper appeal and falling returns for retailers. For some malls, there will be no halting the decline: particularly in discretionary categories, mediocre retail faces a steady demise as “functional” purchasing shifts online or to other formats such as off-mall discount stores. At the same time, leisure services are capturing a greater share of discretionary spending—at the expense of retail. Some mall owners have opportunities to buck this pessimistic narrative. As functional purchases move away from malls, higher-quality centers can refocus on the leisure shopper with spectacular retail formats; centers can piggyback on e-commerce by adding services such as buy online, pick up in mall; and, malls can transform themselves into destinations by adding leisure services. This first report in our series America’s Changing Shopping Centers offers a data-rich exploration of where malls stand now. Future reports will take a thematic approach, discussing what tactics mall-owning real estate investment trusts (REITs) are using—and what they should do to keep ahead of the structural changes in retail. We define shopping malls as enclosed shopping centers with a mix of anchor stores and smaller, in-line stores. Open-air centers such as strip malls and power centers are not included. Coronavirus Set To Hit Malls This report was prepared before the impact of the coronavirus reached severe levels in the US. We expect malls and mall-based retailers to be heavily impacted. As we go to press, a growing number of retailers are closing US stores. And we expect shoppers to be disproportionately avoiding the enclosed spaces and discretionary store formats that dominate malls. Mid-February 2020 Coresight Research consumer survey data shows malls were already among the most avoided type of locations:- Some 27.5% of respondents said they were already avoiding public areas or limiting visits to public areas or changing travel arrangements.
- Among those currently changing behavior, shopping centers/malls were narrowly the third-most-avoided type of location, trailing public transportation and fractionally behind international travel. Some 47% of those who had changed their behavior as of mid-February were avoiding shopping malls/centers.
- Among those who said they were likely to take action if the outbreak worsens, shopping centers/malls jumped to first place, with around three-quarters expecting to avoid or limit their visits to these types of location.
In Brief, How We Got Here
The encroachment of e-commerce to the detriment of physical retail is well documented. However, the online channel’s real impact is sometimes underestimated due to the focus on all retail, which is distorted by low e-commerce penetration in grocery. Shopping malls focus on nonfood, categories in which and the online channel is much more significant, including core categories such as apparel. We estimate around one-fifth of all US nonfood retail and apparel sales were online in 2019. By 2030, we estimate the share of nonfood sales made online will double to over 40%. The recent spate of mass closures largely represents a reaction to the sales that have already headed from stores to e-commerce. We expect this migration to continue, leading to a continued, steady contraction in US physical retail in the coming years. [caption id="attachment_105217" align="aligncenter" width="700"]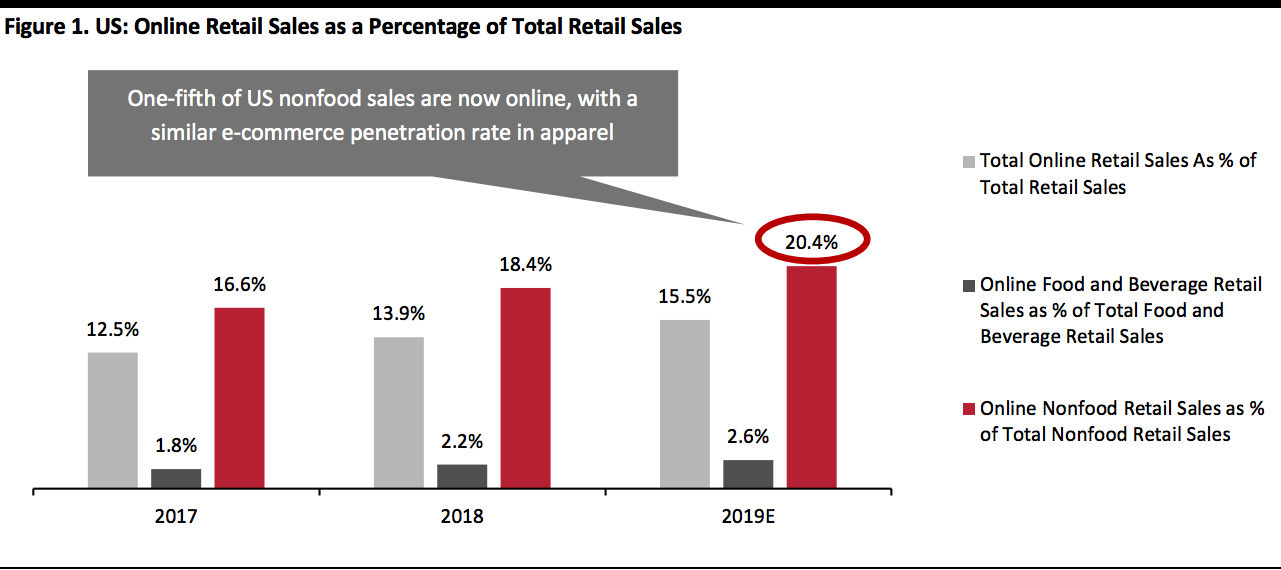 Source: US Census Bureau/US Bureau of Economic Analysis/Coresight Research[/caption]
The shift toward digital channels is not the only factor impacting physical retail. Discretionary spend has been incrementally shifting from products to services, as shoppers choose to spend on leisure experiences over discretionary product purchases.
Back in 2000, we saw an even split between goods and services in discretionary spending. But a substantial gap open in the intervening 19 years, equating to $275 billion of discretionary spending on goods “lost” to services, versus what would have been spent had the split remained constant.
Assuming this trend continues, we see an additional $111 billion of spending that would otherwise have gone to goods to peel away to services by 2025.
[caption id="attachment_105218" align="aligncenter" width="580"]
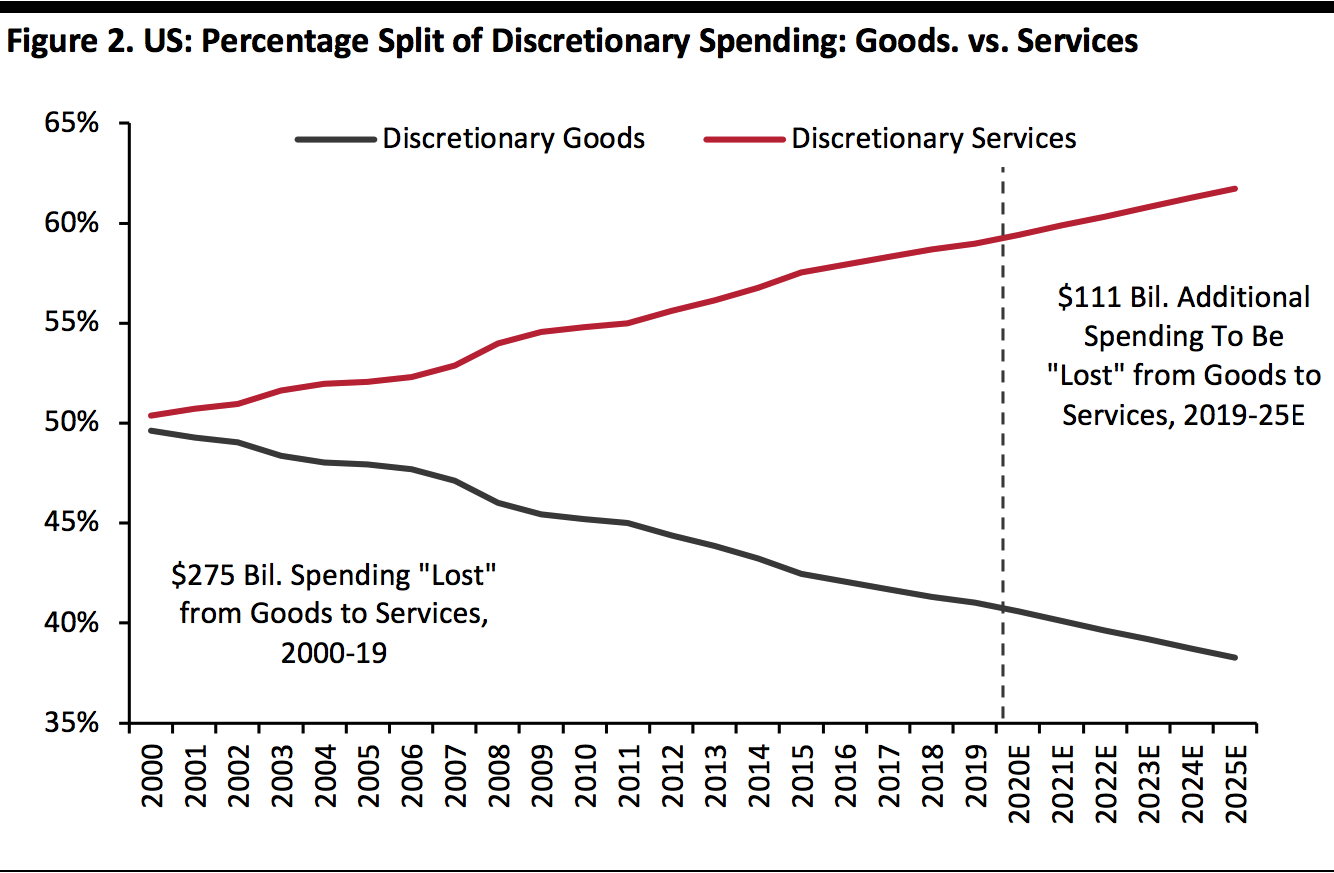 Dollar figures represent spending lost compared to if the distribution had remained constant at 2000 levels (for 2000–2019) and 2019 levels (for 2019–2025E).
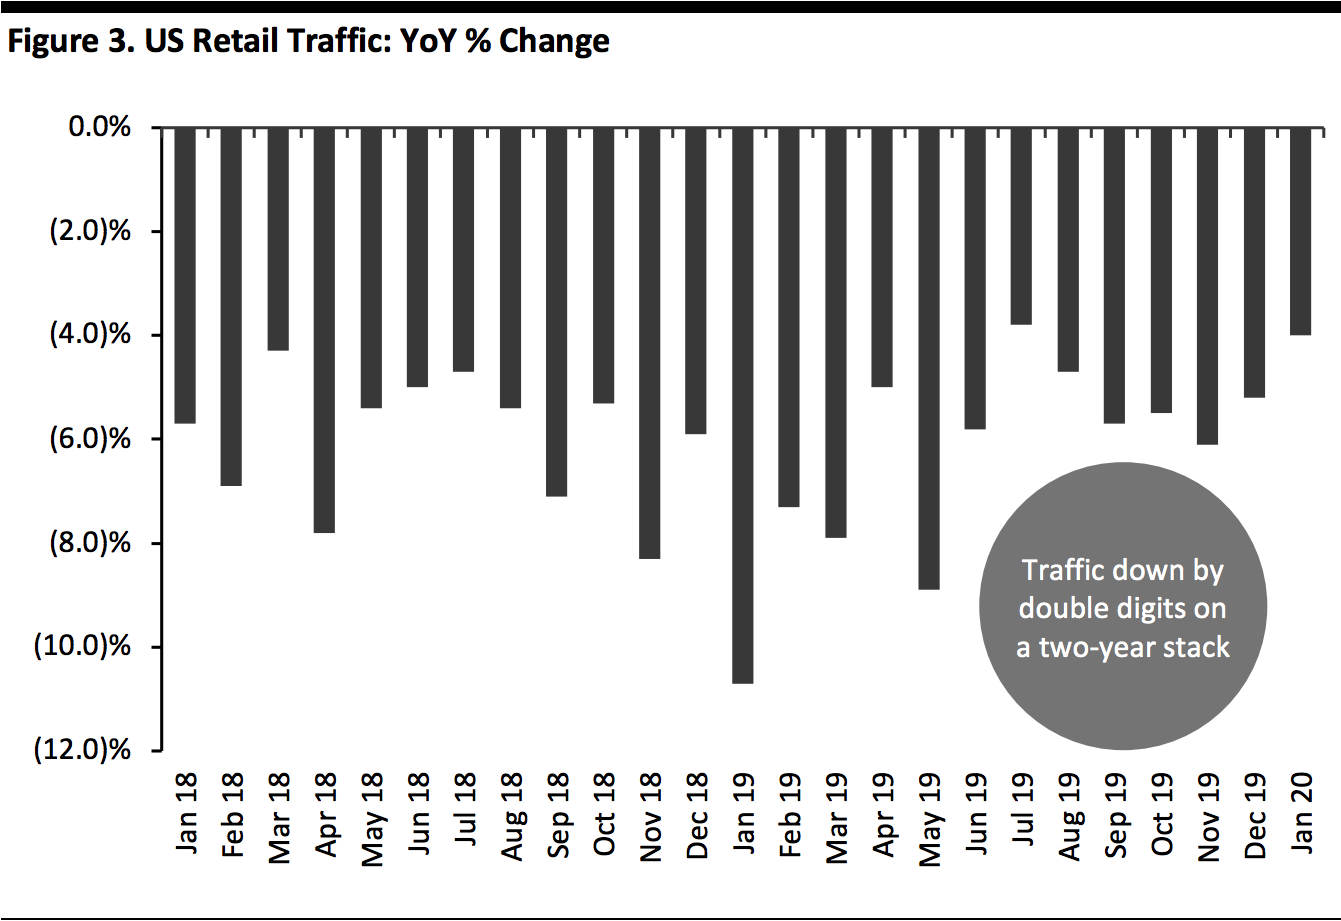
Source: US Bureau of Economic Analysis/Coresight Research[/caption] Shopper traffic is down sharply: Monthly data from RetailNext suggests total retail traffic is consistently down by a double-digit percentage on a two-year stack. However, these numbers may paint a more downbeat picture than is actually the case. This is not only about shoppers replacing store visits with online purchases; the figures represent shoppers undertaking research and planning online before a store visit, resulting in more selective, targeted trips to malls and stores: shoppers arrive at the mall already informed. [caption id="attachment_105219" align="aligncenter" width="580"]
 Source: RetailNext[/caption]
Stores Lag E-Commerce Migration; Malls Lag Store Closures
US brick-and-mortar retail, including malls, have not reshaped sufficiently in response to the channel shifts that have occurred—and that will continue. In the five years ended 2019, total US retail selling space fell a modest 3%, according to Euromonitor International, while the total gross leasable area (GLA) in malls increased 0.5%, according to the ICSC. In the meantime, offline (i.e., mainly in-store) sales as a proportion of total nonfood sales fell 8.3 percentage points from an estimated 87.9% to 79.6%, Coresight Research estimates. A couple of decades ago, this share would have been close to 100%. As we noted earlier, we expect the decline in offline’s share of sales to continue apace. However, the offline channel has not declined in cash terms, with offline nonfood sales increasing an estimated 10.9% between 2014 and 2019—a CAGR of 2.1%. This, however, is in the context of a growing total market and includes inflation. [caption id="attachment_105220" align="aligncenter" width="700"]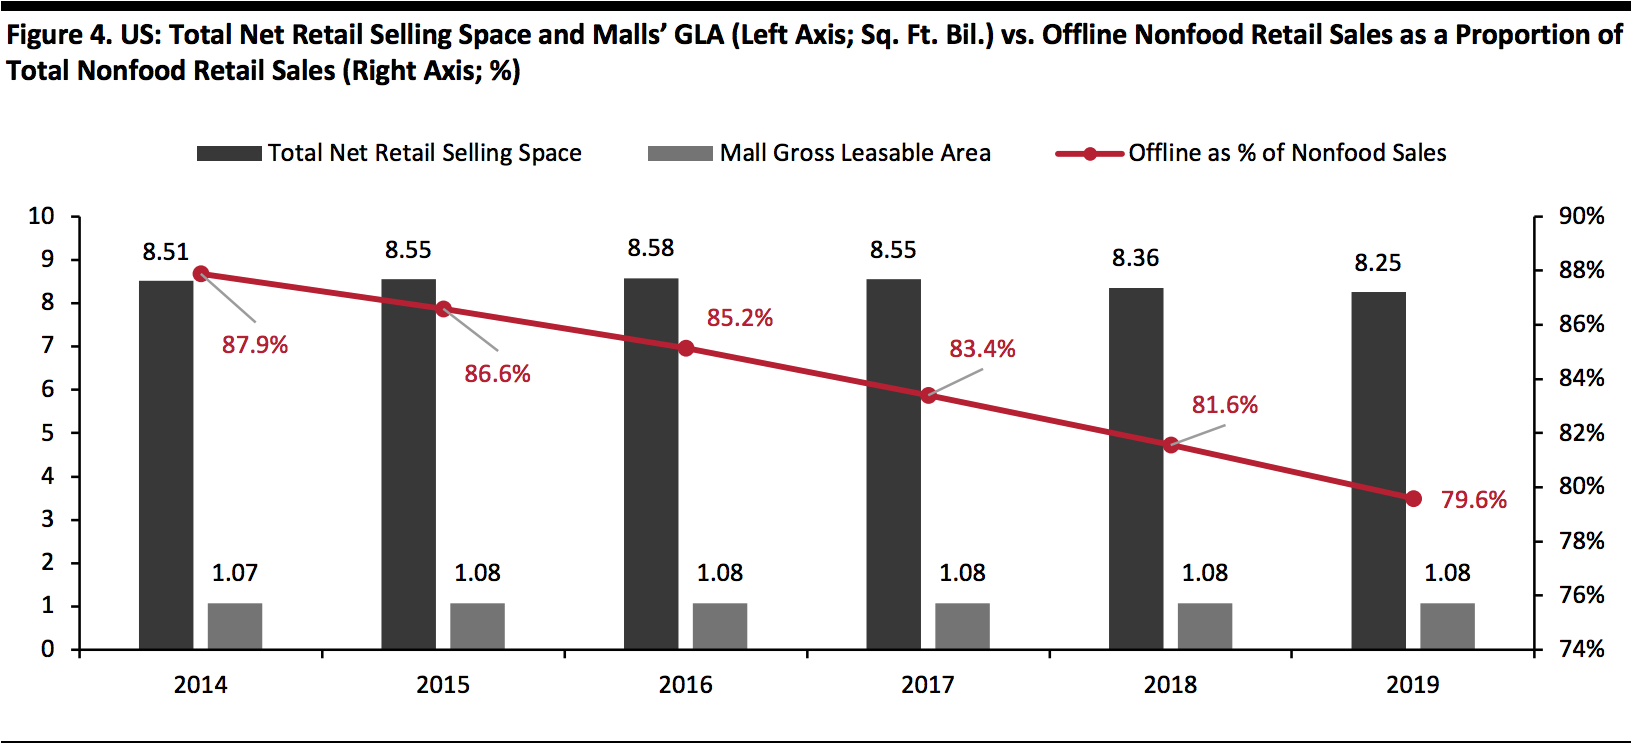 Offline retail sales are predominantly in-store with a small element of home shopping, traditional markets, etc.
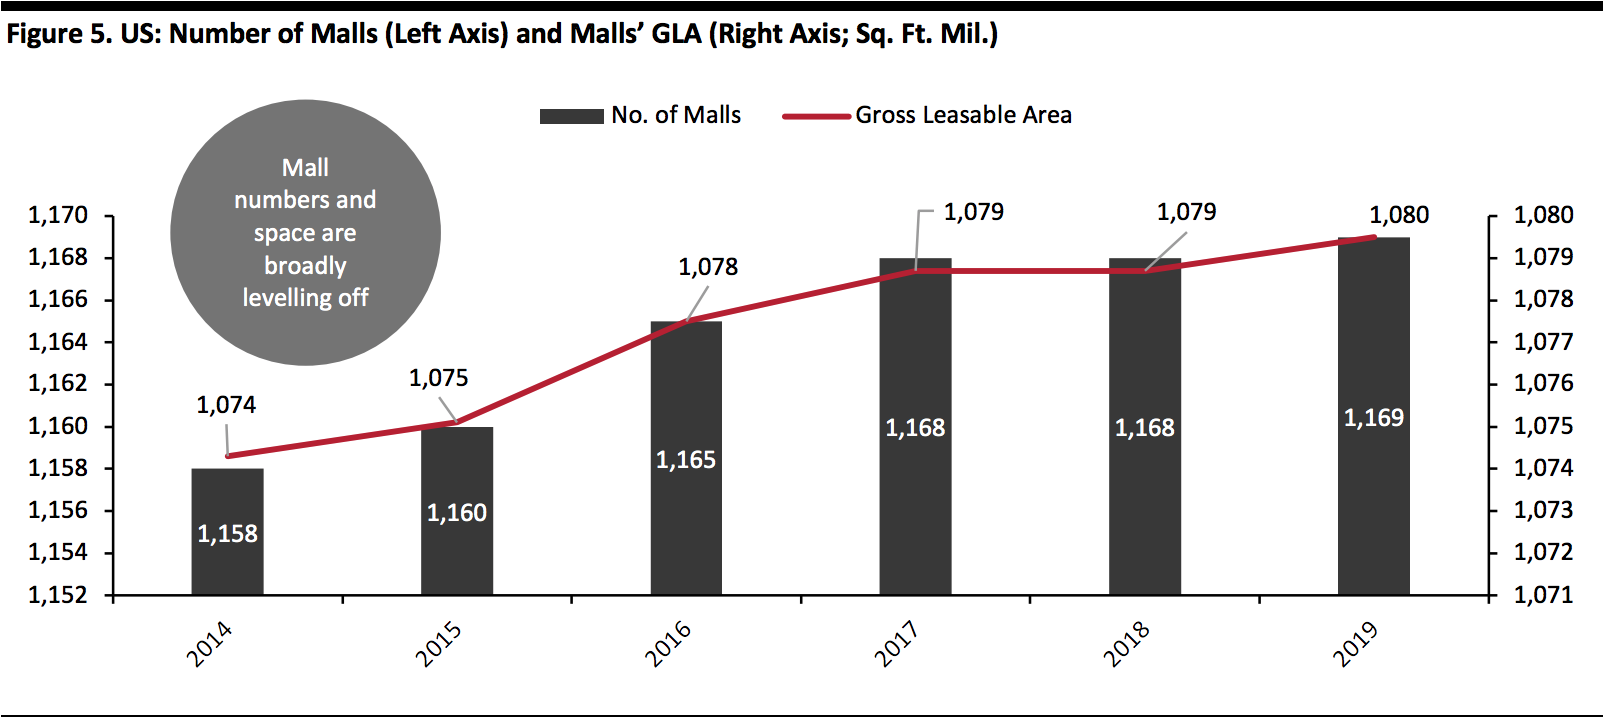
Source: Euromonitor International Limited 2020 © All rights reserved/ICSC/Coresight Research[/caption] While we have begun to see a small decline in total retail square footage in recent years, total mall numbers and space have only broadly leveled off, as shown in the chart below: 2019 saw a net one addition to the US mall count, taking the total to 1,169. Mall space is therefore trailing the closure trend in retail. In the coming years, we expect to see the plateau in mall space turn into a decline, as lower-tier malls shutter and the mall landscape incrementally refocuses on fewer, higher-quality centers. [caption id="attachment_105221" align="aligncenter" width="700"]
 Source: ICSC/Coresight Research[/caption]
As shown in the chart below, we see a double lag in the reshaping of brick-and-mortar retail to a digitalized landscape as physical store rationalization has lagged the migration of sales to online channels, and rationalization of mall space and mall numbers has, in turn, lagged physical store closures. In summary, a correction looks overdue.
[caption id="attachment_105222" align="aligncenter" width="700"]
 Source: Coresight Research[/caption]
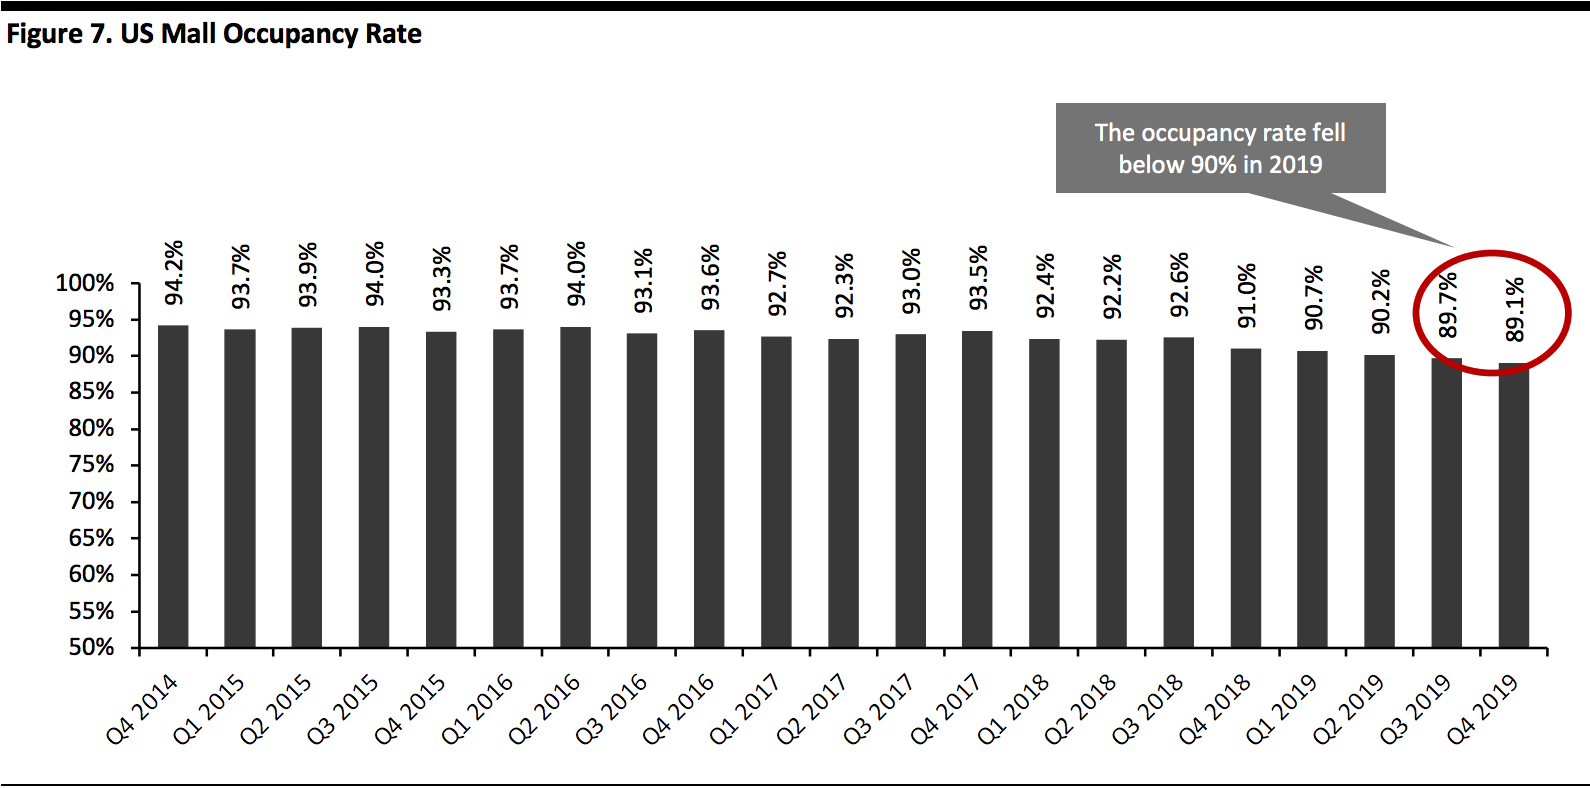
The overall mall occupancy rate has been declining as stores have continued to close but malls remain open, falling below 90% in the second half of 2019, according to the National Council of Real Estate Investment Fiduciaries. The year ended with an occupancy rate more than five percentage points lower than five years earlier.
[caption id="attachment_105223" align="aligncenter" width="700"]
 Source: National Council of Real Estate Investment Fiduciaries[/caption]
Coresight Research recorded 9,399 store closures in 2019, accelerating dramatically from 5,706 in 2018 and ahead of the prior peak of 8,069 closures in 2017. This was partially offset by 4,486 openings in 2019, compared to 3,747 in 2018 and 5,099 in 2017. But total store numbers do not tell the full story.
In square-footage terms, the volume of closures declined in 2019: Coresight Research estimates just under 117 million square feet of gross retail space closed in 2019, down from more than 158 million square feet gross in 2018. And, we recorded just 67 million square feet of gross openings in 2019 versus 72 million square feet gross in 2018.
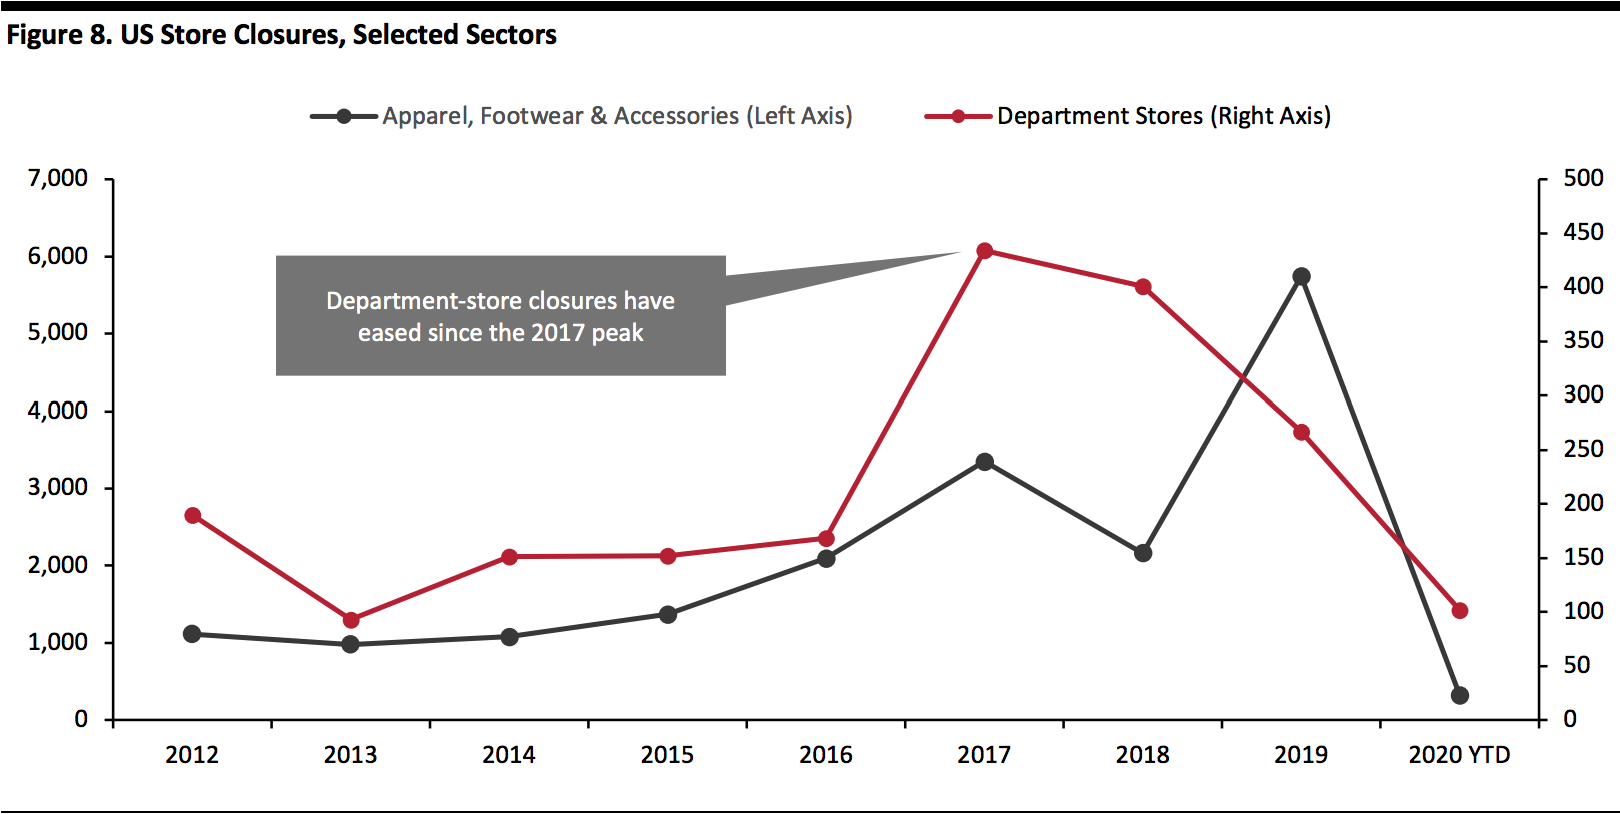
The decline in closed square footage is because department store closures eased further in 2019 following a peak in 2017. Anchor tenants such as department stores typically account for over half of malls’ GLA, underscoring the structural weakness in malls’ dependence on anchors and the challenges malls face in the wake of coming closures from retailers such as Macy’s.
Apparel store closures, which are typically small-format, jumped in 2019. Apparel stores accounted for fully 61% of 2019’s record store closures: we recorded 5,743 apparel store closures in 2019, up 166% from 2,161 in 2018. This drove the jump in unit closures in 2019 even though the volume of space closed declined.
[caption id="attachment_105225" align="aligncenter" width="700"]
 2020 YTD figures are as of February 28
Data is gross—i.e., excluding openings
Source: Company reports/Coresight Research[/caption] The traditional emphasis on apparel has proven a weakness for many malls, especially lower-tier regional malls with less diversified offerings. As e-commerce gets close to capturing one-quarter of US apparel sales, we estimate the proportion of mall space occupied by apparel stores will fall below 40% this year, from 45% in 2016. In the meantime, the structural shift to e-commerce threatens to push more anchor department stores to close. By 2030, we expect US department store total square footage to fall by half, driven by bankruptcies, further store-closures and conversions to higher-growth formats such as discount and off-price. At the same time, we expect most major large-store nonfood retailers in the US to launch smaller-store programs, such as Target’s, by the end of this decade. We also expect inventory-free concepts such as Nordstrom Local to become more common. [caption id="attachment_105226" align="aligncenter" width="700"]
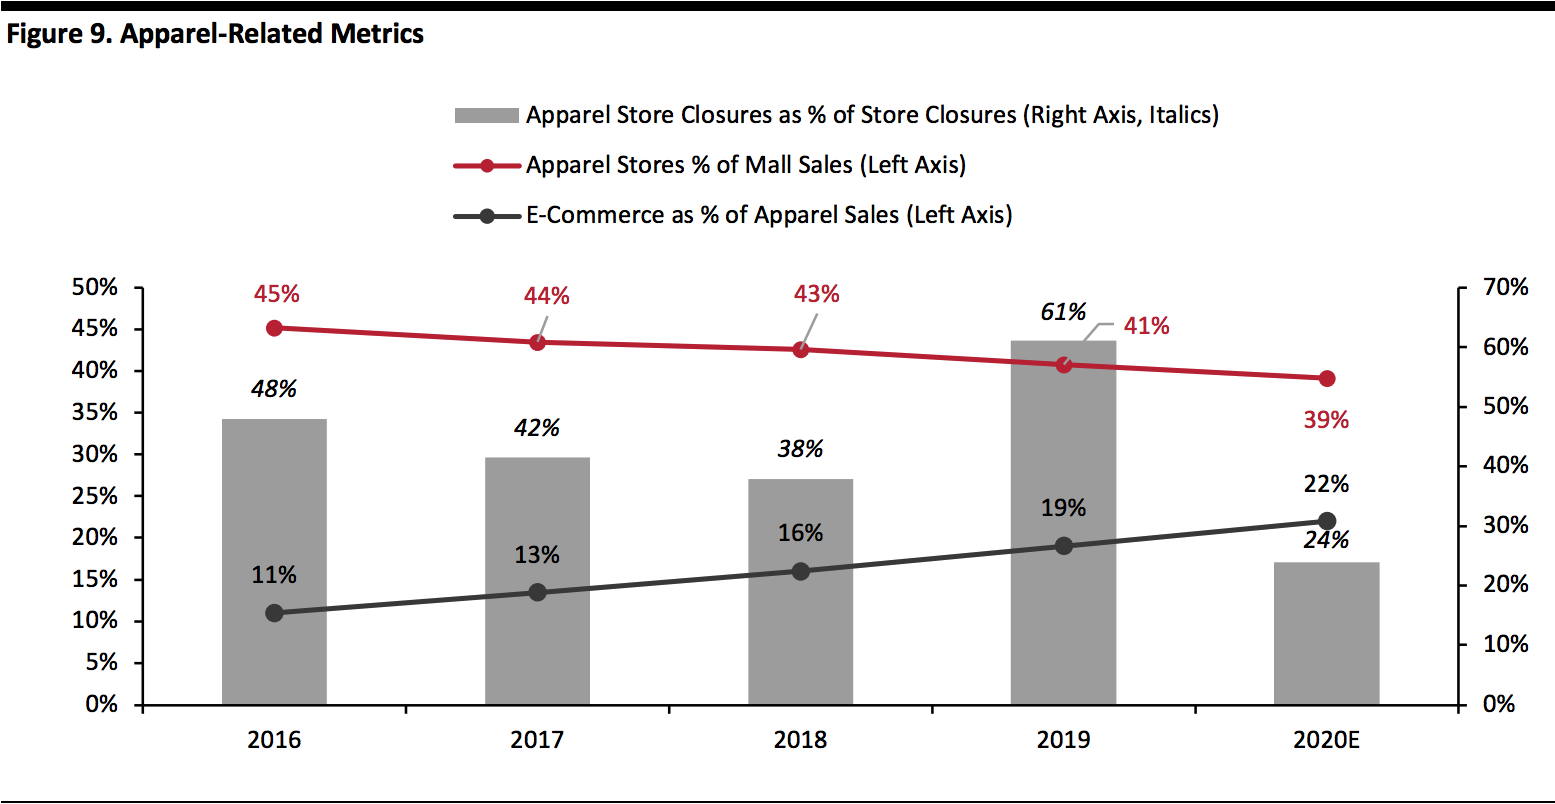 Apparel stores as a % of mall sales are estimated for 2018 and 2019 (and all data is estimated for 2020). 2020E apparel store closures as a % of store closures is YTD as of February 20. Store closures are gross (excluding openings).
Source: ICSC/Statista/Coresight Research[/caption]
Impact Will Not Be Evenly Felt
A key consideration for malls’ prospects is the quality of space:- Some 36.4% of US malls were low-tier “C” or “D” malls in 2019, according to our analysis of data cited by Taubman. A further 36.3% of malls were “B” malls with only 27.3% top-tier “A” malls.
- Also in 2019, the ICSC classified 49% of malls as regional malls, defined as 400,000–800,000 square feet of GLA; and 51% of malls as superregional malls, defined as 800,000+ square feet of GLA and with more diverse offerings than regional malls.
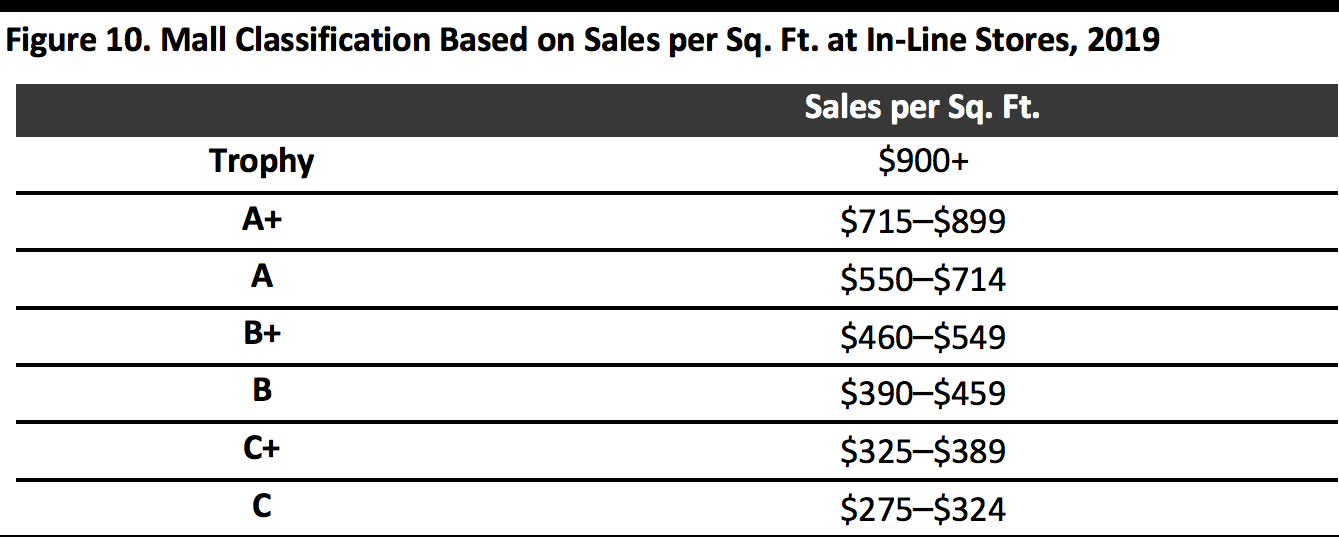 Source: Korpacz Realty Advisors[/caption]
Based on reported average sales per square foot, we map selected major REITs to these mall classifications in the table below. Note, the classification based on the overall average of sales per square foot for all malls owned by the REIT.
This data underscores the appeal of Taubman, acquired by Simon in early 2020.
[caption id="attachment_105228" align="aligncenter" width="580"]
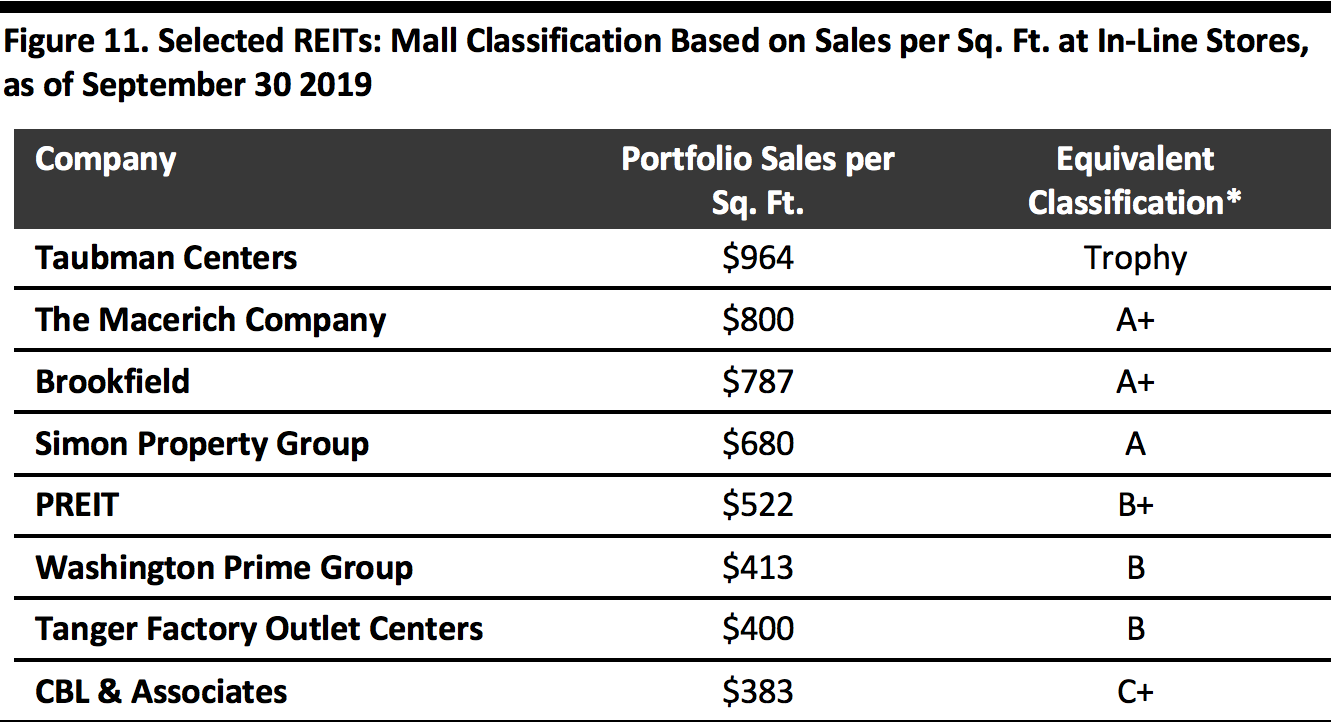 No data for Unibail-Rodamco-Westfield. Based on Korpacz Realty Advisors classification.
Source: Company reports/Korpacz Realty Advisors[/caption] Below, we show the shopping centers with the highest sales densities as of 2017 (latest reported). These data points provide information about which REITs own higher-value centers. [caption id="attachment_105229" align="aligncenter" width="700"]
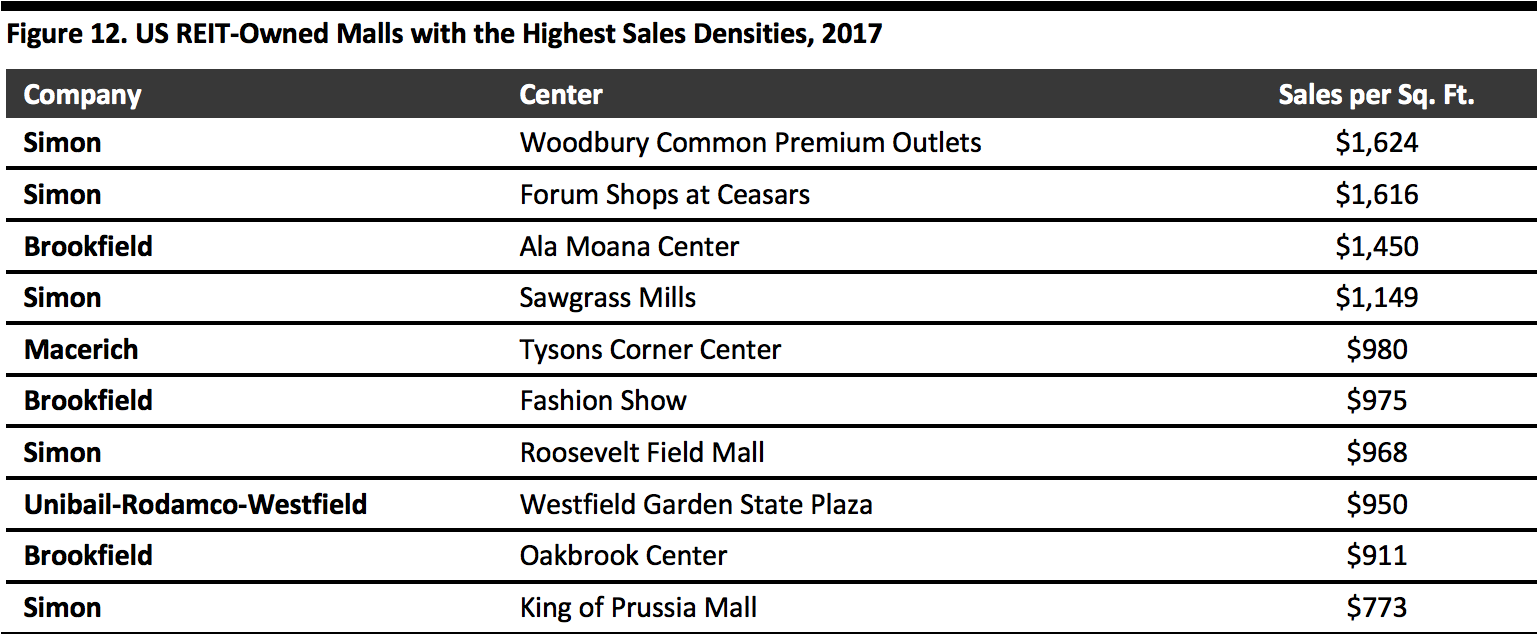 Source: Boenning & Scattergood/CNBC/Statista[/caption]
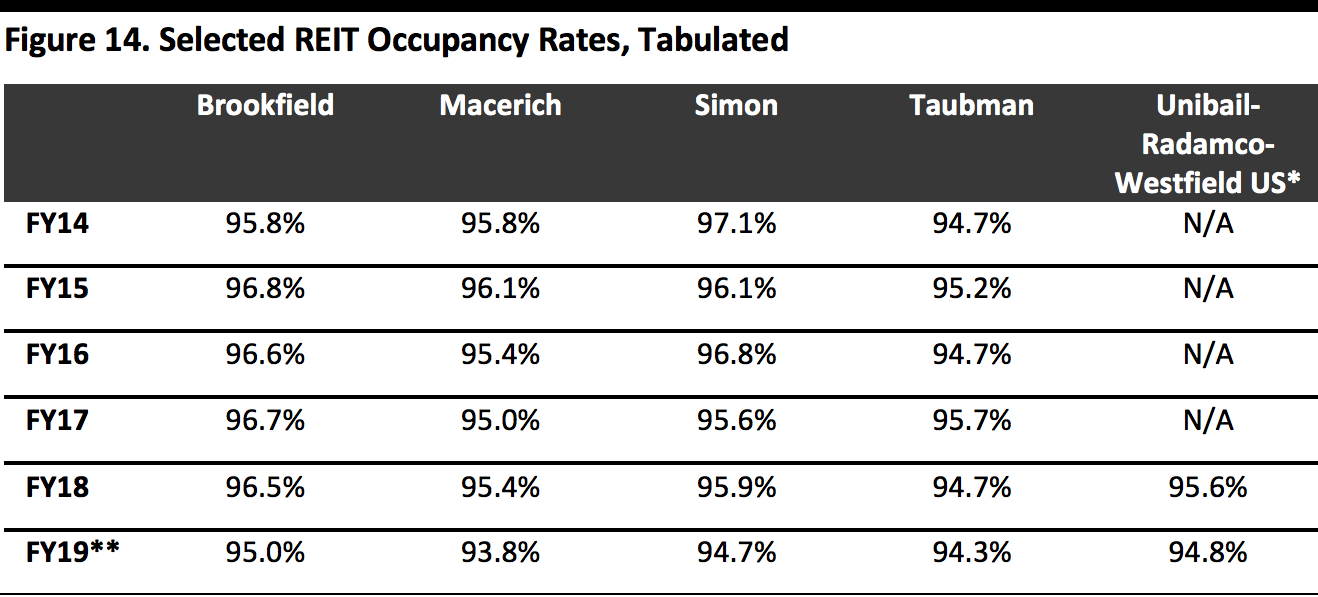
For sustained shopper appeal and overall resilience, well-invested, tenant-rich, higher-tier malls have a more solid future than undistinguished regional malls. However, data on occupancy rates suggests the mass store closures we saw in 2017–2019 did hit the major REITs, even those focused on higher-end properties.
The difference will be that higher-tier malls impacted by closures will more easily fill vacant space—and be able to command premium rent for that space. Indeed, higher-quality operators such as Simon and Macerich have reported meaningful rent increases for re-leased space.
[caption id="attachment_105230" align="aligncenter" width="700"]
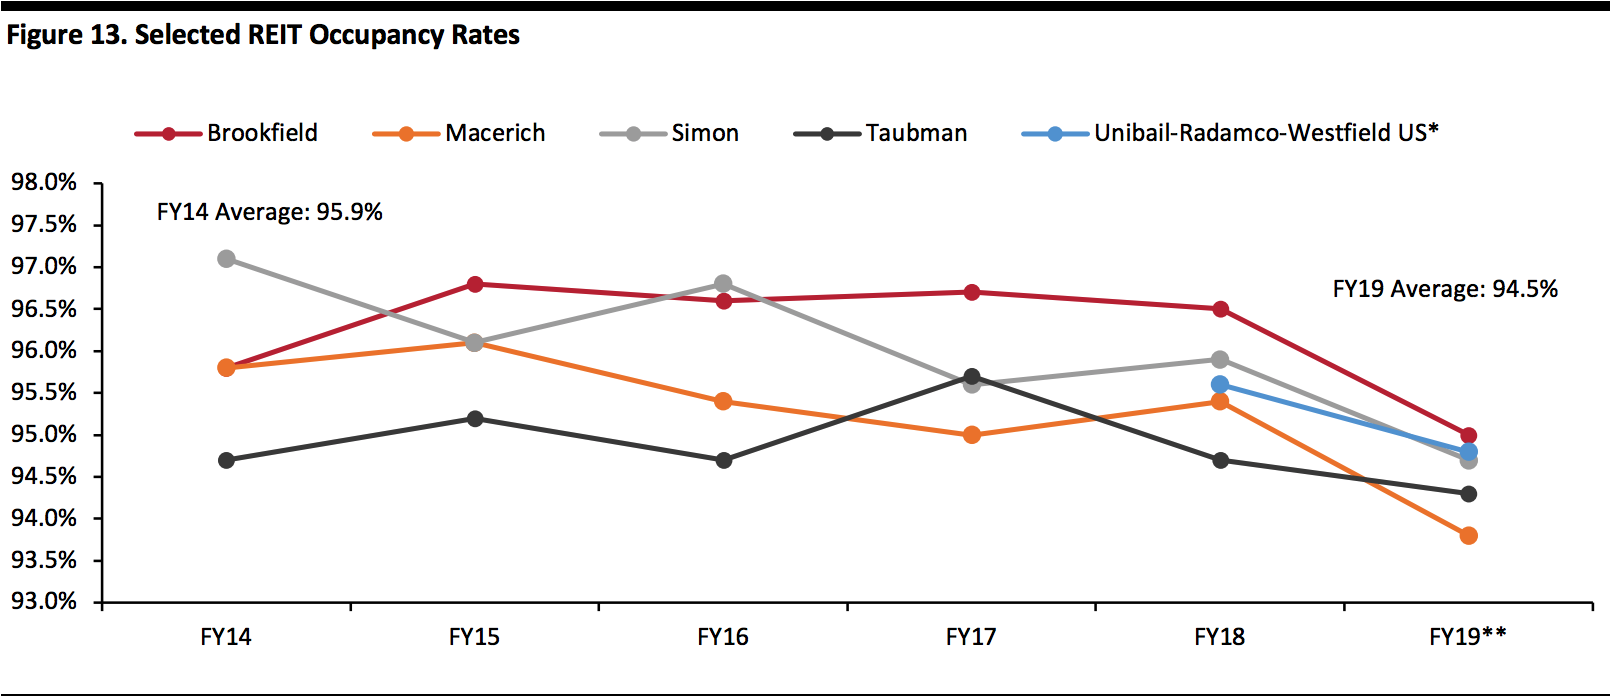 *No data is available pre-FY18 for Unibail-Rodamco-Westfield
**3Q19 for Macerich, Simon and Brookfield
Source: Company reports[/caption] [caption id="attachment_105231" align="aligncenter" width="580"]
 *No data is available pre-FY18 for Unibail-Rodamco-Westfield
**3Q19 (latest) for Macerich, Simon and Brookfield
Source: Company reports[/caption]
Putting It in Context
The mall is challenged but there are two caveats.- First, as we noted above, when it comes to the challenges they face, all malls were not created equal: We will see unexceptional regional malls with a focus on apparel retail and limited service or experience offerings suffer most.
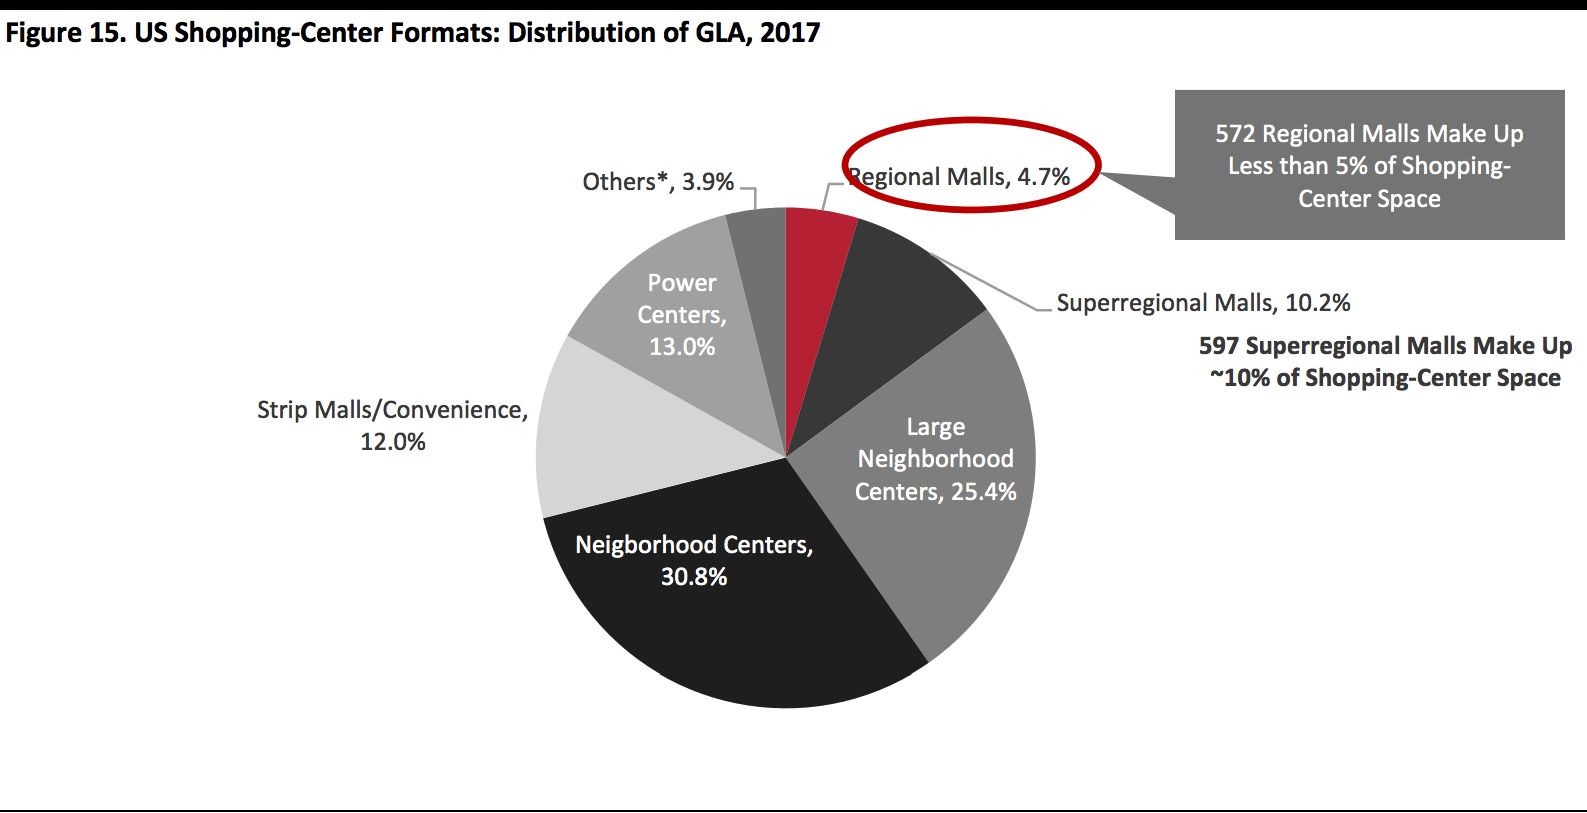
- Second, malls in general, and regional malls in particular, represent only a small fraction of the US shopping-center landscape. As shown below, regional malls accounted for just 5% of shopping-center GLA in 2017 (latest) and superregional malls—which are likely to prove more resilient—just 10%. And, as of 2019, regional and superregional malls accounted for just 1% of all shopping centers, according to ICSC data. So, malls do not represent the totality of physical retail.
 Regional malls are defined as 400,000–800,000 sq. ft. GLA; superregional malls are defined as 800,000+ sq. ft. GLA and with more diverse offerings than regional malls
*Includes lifestyle centers, factory outlets, theme/festival centers and airport retail
Source: ICSC[/caption]
Where Next?
Future reports in this series will examine what mall owners are doing now—and what they should do next to survive and thrive amid the challenging retail landscape. In the short to medium term, the coronavirus is likely to provide a sharp shock to physical retail. As stores shutter and consumers avoid public places, we expect shopper traffic to discretionary store formats to slow to a trickle, even if there is not a total lockdown. The impacts on brick-and-mortar retailers are not yet clear: As we write, we do not know how long any such shutdown will last, nor to what extent shoppers will bounce back and revert to previous shopping behaviors once the coronavirus outbreak ends. We will continue to cover the outbreak’s impact in retail in coming reports. Looking longer term, by 2030, we expect US physical retail—which includes shopping centers—to become more focused on three concepts:- Lean retail: Physical retail networks will be radically slimmed down and more responsive to changes in demand.
- Spectacular retail: Will become entrenched in discretionary retail sectors. Flagship stores will offer spectacular shopping environments, in-store experiences and digital integration.
- Frictionless retail will see more intelligent interventions and a higher degree of automation to drive pain points out of shopping, especially in nondiscretionary retail such as grocery.
Source for Euromonitor International data: Euromonitor International Limited 2020 © All rights reserved