Introduction
Amazon Prime Day 2020 began in the US at midnight Pacific Daylight Time (3:00 a.m. EDT) on October 13. The event ran for 48 hours and offered more than 1 million deals for Prime members, according to the company. Worldwide, this shopping extravaganza was held in 19 countries this year.
In this report, we analyze the scale and distribution of price cuts on Amazon.com on Prime Day this year, and we provide some brief comparisons to the price cuts at Best Buy, Target and Walmart during the event. In collaboration with competitive intelligence provider DataWeave, we aggregated data on prices in four categories on Amazon’s US site: beauty, electronics, men’s fashion and women’s fashion.
Amazon Prime Day 2020: Overview of Discounts
We used the average of each product’s price from October 10 to 12 as the pre-Prime Day base and analyzed price differences on October 13 and 14. Our data suggest that average Prime Day discounts on Amazon.com were modest, with three of the four tracked categories seeing an average single-digit price cut.
Overall, women’s fashion offered the highest average discount on both days, and electronics the lowest. However, the electronics category had the highest percentage of goods on sale and the highest percentage of products that continued to lower prices from the first day.
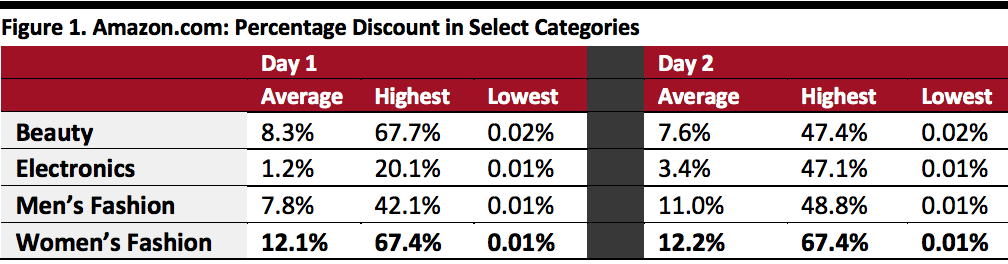
As shown in Figure 1 below, women’s fashion had average double-digit-percentage discounts across the Prime Day event, with price cuts on tracked products as high as 67%. Men’s fashion and beauty witnessed an average high-single-digit-percentage reduction in prices, while electronics saw an average low-single-digit-percentage drop in prices. Our tracked products in the electronics category exclude Amazon’s own devices, such as Echo Dot and Fire TV Stick, which saw deep discounts during the Prime Day event.
[caption id="attachment_118081" align="aligncenter" width="700"]
 Source: DataWeave/Coresight Research
[/caption]
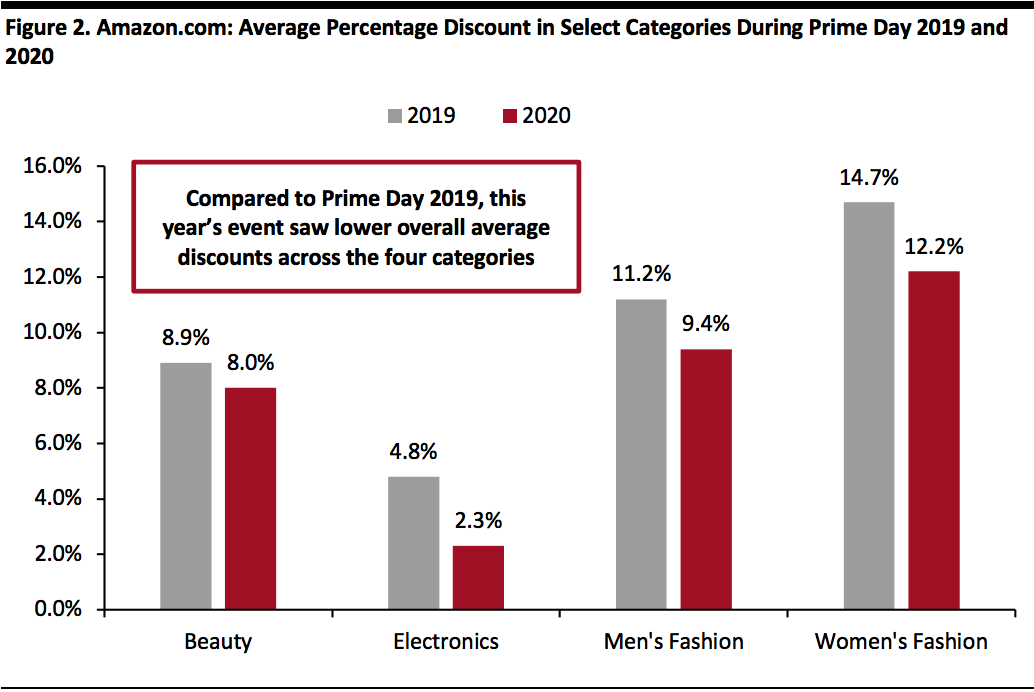
Compared to
Prime Day 2019, which occurred on July 15–16 last year, Prime Day 2020 witnessed lower overall average discounts across the four categories of beauty, electronics, men’s fashion and women’s fashion (as shown in Figure 2).
[caption id="attachment_118082" align="aligncenter" width="700"]
 Source: DataWeave/Coresight Research
[/caption]
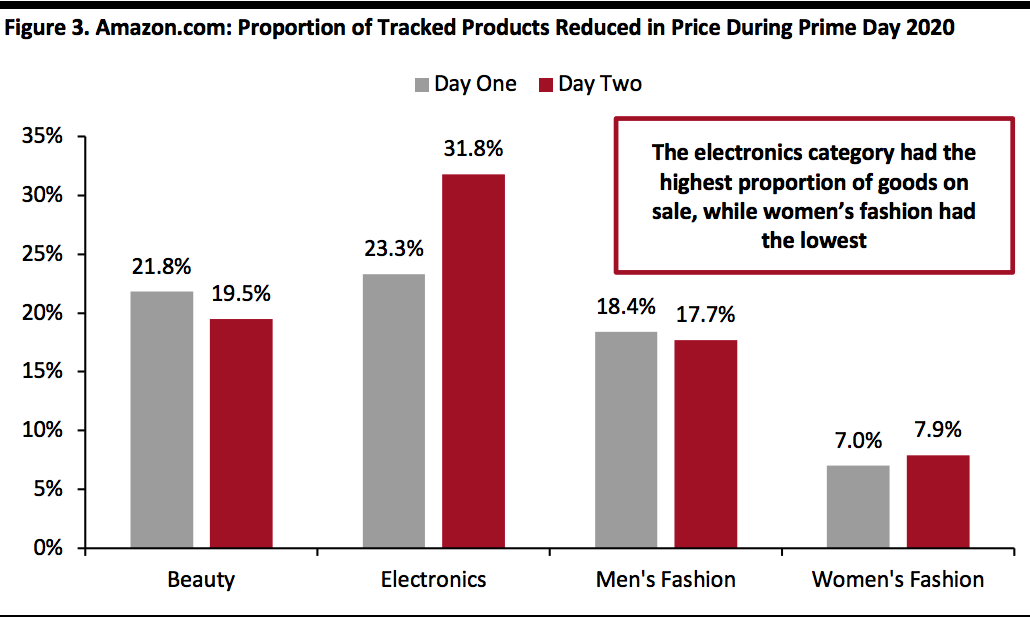
During the Prime Day 2020 event, the proportion of tracked products discounted in price across the two days ranged from high-single digits in women’s fashion to more than 30% in the electronics category. However, some tracked products saw price increases during the event, which we discuss later.
[caption id="attachment_118083" align="aligncenter" width="700"]
 Source: DataWeave/Coresight Research
[/caption]
Amazon Prime Day 2020: Pricing Insights in Detail
Beauty
We analyzed the prices of 518 products, selected from the top featured goods across different beauty subcategories. Surprisingly, we tracked more price rises than price falls during the Prime Day event. As with price rises in other tracked categories, the increases could have been due to Amazon’s pre-event daily deals, which were offered between September 28 and Prime Day.
On the first day, 21.8% of products were offered at lower prices, but 24.9% were offered at higher prices than the average from the October 10–12 pre-sale period. Discounts ranged from 0.02% to 67.7%, with an average of 8.3%. A mere 0.4% of discounted products decreased prices further on day two.
On the second day, 19.5% of products were offered at lower prices, but 26.6% had prices of higher than the average from October 10–12. Discounts ranged from 0.02% to 47.4%, with an average of 7.6%.
Between October 13 and October 14, just 1.7% of products had a price reduction greater than $1.00.
Electronics
We analyzed the prices of 400 products, selected from the top featured goods across different electronics subcategories. We saw many electronics products reduced in price, but a substantial number saw price rises, too. As mentioned previously, our tracked products in the electronics category exclude Amazon’s own devices, such as Echo Dot and Fire TV Stick, which saw deep discounts during the event.
On the first day, 23.3% of products were offered at lower prices, but 19.3% were offered at higher prices than the average from the pre-sale period. Discounts ranged from 0.01% to 20.1%, with an average of 1.2%. Only 5.3% of discounted products continued to decrease prices on day two.
On day two, 31.8% of products were offered at lower prices, but 25.3% were offered at higher prices than the average from October 10–12. The average discount was 3.4%, with a range of 0.01% to 47.1%.
Between October 13 and 14, 25.8% of products had a price reduction that was greater than $1.00.
Men’s Fashion
We analyzed the prices of 588 products, selected from the top featured goods across different men’s fashion subcategories. We tracked substantial price rises alongside price reductions.
On the first day, 18.4% of products were offered at lower prices and 17.5% at higher prices than the average prices from the pre-sale period. Discounts ranged from 0.01% to 57.2%, with an average of 7.8%. Only 2.0% of discounted products continued to decrease prices on day two.
On the second day, 17.7% of products were offered at lower prices than the average during October 10–12, while 17.9% were priced higher. Discounts ranged from 0.01% to 50.1%, with an average of 8.2%.
Over the two days, 10.9% of products had a price decline of greater than $1.00.
Women’s Fashion
We analyzed the price of 655 products, selected from the top featured goods across different women’s fashion subcategories. Across our tracked products, we recorded more price rises than price reductions.
On the first day, 7.0% of products were offered at lower prices, while 8.2% were higher than the average price during October 10–12. Discounts ranged from 0.01% to 67.4%, with an average of 12.1%. None of the discounted products continued to decrease prices on day two.
On the second day, 7.9% of products were offered at lower prices than the pre-sale-period average, while 8.9% were offered at higher prices. Discounts ranged from 0.01% to 67.4%, with an average of 12.2%.
Over the two days, only 1.5% of products had a price decline of greater than $1.00.
Amazon Prime Day 2020 Sees Estimated Sales of Around $6 Billion
Amazon does not disclose figures for sales generated during Prime Day. However, the company’s headline story was that third-party sellers generated sales of over $3.5 billion worldwide during the event. This is the closest indication of total sales that Amazon has given for its Prime Day events.
We estimate that third-party sellers accounted for around 58.5% of product sales on the platform, by value, in 2019. This is based on a GMV split disclosed by Amazon for 2018 (Amazon does not routinely disclose its GMV). Applying this percentage to Prime Day and based on the information disclosed by Amazon following Prime Day,
we estimate the event generated global sales in the region of around $6 billion this year—$3.5 billion by third-party sellers and $2.5 billion in first-party sales by Amazon.
Our figures reflect estimated product sales online (GMV) and exclude revenues from additional Prime membership sign-ups during Prime Day.
Best Buy, Target and Walmart Offer Notable Discounts During the Prime Day Event Period
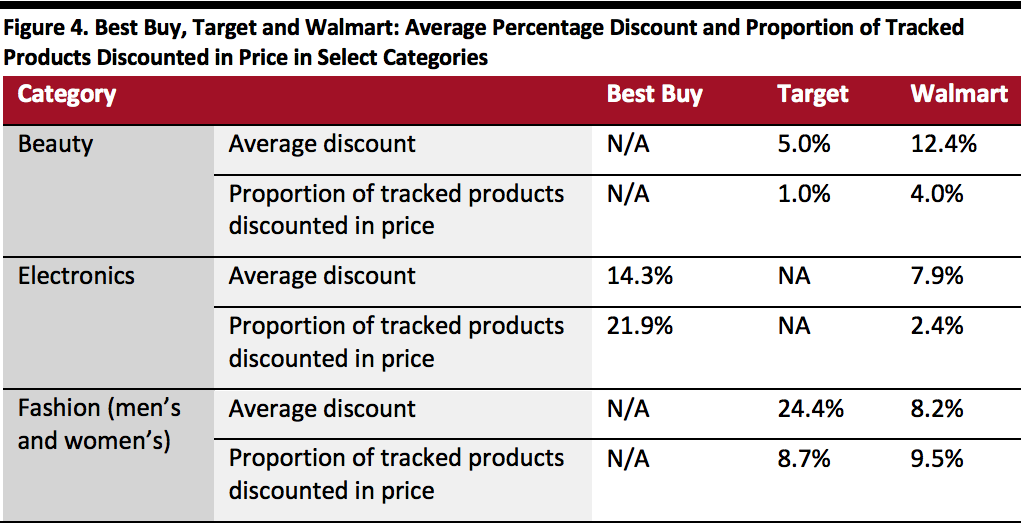
Similar to last year, other US retailers jumped on the Prime Day bandwagon, offering their own promotions to coincide with the event. We collated data on online price reductions by Best Buy, Target and Walmart, as well as Amazon.
[caption id="attachment_118084" align="aligncenter" width="700"]
 Source: DataWeave/Coresight Research
[/caption]
Key Insights
Following a delay of nearly three months, Amazon Prime Day 2020 coincided with the start of holiday shopping season. We expected that the postponement of Prime Day from July
would pull forward holiday season demand and kickstart a highly promotional final quarter. We estimate the Prime Day event to have achieved around $6 billion in total sales globally, a 13% uptick year over year.
Our data imply that Amazon has achieved this success with relatively limited average pricing commitments by it or third-party sellers on its US site—although Amazon claimed that Prime members saved more than $1.4 billion on Prime Day 2020. Average price cuts across each of our tracked categories were lower in Prime Day 2020 than during the event last year. Furthermore, within beauty and women’s fashion, we saw more price rises than price falls across both days of the Prime Day event. This may be partially due to Amazon offering daily deals in the period between September 28 and Prime Day. In its press release, Amazon said that it held its biggest promotion ever for small businesses on its platform in the lead-up to the event—during the two weeks prior to Prime Day, small businesses generated over $900 million in sales.
Retailers such as Best Buy, Target and Walmart offered deals and promotions alongside Amazon Prime Day 2020 to officially kick-start holiday shopping, expand their influence and compete with the e-commerce giant. Going forward, with the rise of loyalty and membership programs, we could see more retailers rivaling Amazon by creating offers and discounts that are available to members only.
About DataWeave
DataWeave is an AI-powered SaaS platform that provides Competitive Intelligence as a Service to e-commerce businesses and consumer brands, enabling them to compete profitably and accelerate revenue growth. The company’s proprietary technology platform helps e-commerce businesses to make smarter pricing and merchandising decisions, as well as consumer brands to protect their online brand equity and optimize their e-commerce performance. Visit the DataWeave
website for more information.