Nitheesh NH
https://youtu.be/a5QL-RsesUc
Introduction
In this report, we continue our coverage of Amazon’s venture into newer categories with an analysis of the beauty and personal care offering on Amazon.com. In collaboration with competitive intelligence provider DataWeave, we aggregated data on over 210,000 products listed on the site. In the sections that follow, we slice and dice the data by brand, product category and type of seller (first party versus third party). We conclude our report with insights from our consumer survey conducted in February 2019 that asked beauty and personal care shoppers which retailers they had bought from and asked Amazon shoppers what beauty and personal care categories they had bought on the site.
In Brief: How We Got Our Data
Our data cover Amazon’s US beauty and personal care offering, which includes categories beyond beauty including skincare, haircare, shave and hair removal, and lip care. We aggregated data in two stages. First, we identified brands with a meaningful presence in Amazon’s beauty offering by finding all brands included in the top 500 featured product listings for each of 34 product types in the beauty categories. This returned a total of 2,499 unique brands
Second, we aggregated data on all product listings within beauty sections for each of the 2,499 identified brands. This returned a total of 212,818 individually listed products which are the basis for the analysis in this report. We present detailed findings by beauty category, brand and type of seller on Amazon.
Top Categories and Brands
1. Makeup and skincare are the top beauty category listings on Amazon, accounting for 60% of all beauty products.
We found that Amazon.com features 212,818 beauty products across 2,499 unique brands spanning eight major beauty categories. By number of products listed, makeup and skincare are the top beauty categories listed on Amazon, accounting for 34% and 26% of beauty product listings, respectively.
Together, makeup and skincare’s combined share of 60% of Amazon’s beauty product listings reflects 127,551 different products.
[caption id="attachment_79907" align="aligncenter" width="800"]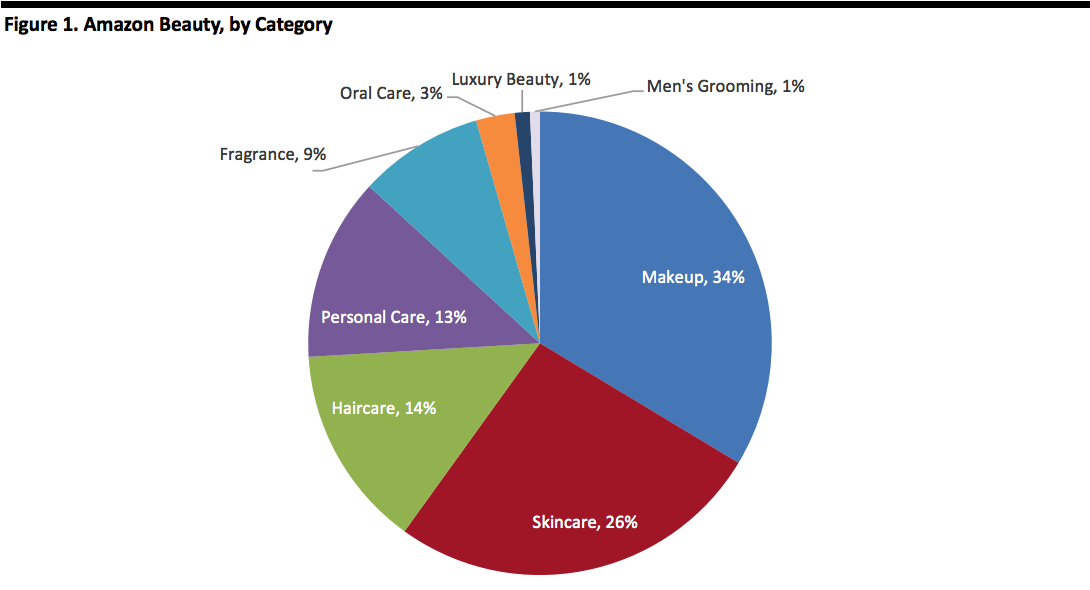 Source: DataWeave/Coresight Research[/caption]
2. The three most-listed brands on Amazon beauty are Maybelline New York, Clinique, and Covergirl.
We identified 2,499 unique brands spanning eight beauty and personal care categories on Amazon.com. The top three beauty brands on Amazon, by number of products listed, are Maybelline New York, Clinique and Covergirl.
Maybelline, a mass makeup brand, took the most-listed spot on Amazon. The brand has over 4,370 listings, and 94.6% of these are listed by third-party sellers and 5.4% through Amazon. As a brand, Maybelline sells across multiple categories – with nearly 55% of its listings in makeup, 44% in skincare and a few listings in haircare.
Clinique is the second-most-listed brand. A prestige brand with mass appeal, Clinique offers over 3,277 listings on Amazon.com and 97.7% of its products listings are listed by third-party sellers. The brand’s primary presence on Amazon.com is in makeup, with 72% of its products on Amazon in this category, plus 25% in skincare, 3% in personal care, and less than 1% in haircare.
Covergirl, a mass beauty brand, was the third-most-listed brand on Amazon.com. The brand has 3,052 listings and 95.7% of those are listed by a third party. The brand’s portfolio is 96% makeup listings, 2% personal care, less than 2% skincare and less than 1% haircare.
The figure below summarizes the number of brands and products we recorded for each Amazon beauty category, and notes the three most-listed brands for each of those categories. While we identified 2,499 unique brands overall, some brands have a presence in multiple categories: For example, Maybelline New York has products in makeup, skincare and haircare.
[caption id="attachment_80267" align="aligncenter" width="580"]
Source: DataWeave/Coresight Research[/caption]
2. The three most-listed brands on Amazon beauty are Maybelline New York, Clinique, and Covergirl.
We identified 2,499 unique brands spanning eight beauty and personal care categories on Amazon.com. The top three beauty brands on Amazon, by number of products listed, are Maybelline New York, Clinique and Covergirl.
Maybelline, a mass makeup brand, took the most-listed spot on Amazon. The brand has over 4,370 listings, and 94.6% of these are listed by third-party sellers and 5.4% through Amazon. As a brand, Maybelline sells across multiple categories – with nearly 55% of its listings in makeup, 44% in skincare and a few listings in haircare.
Clinique is the second-most-listed brand. A prestige brand with mass appeal, Clinique offers over 3,277 listings on Amazon.com and 97.7% of its products listings are listed by third-party sellers. The brand’s primary presence on Amazon.com is in makeup, with 72% of its products on Amazon in this category, plus 25% in skincare, 3% in personal care, and less than 1% in haircare.
Covergirl, a mass beauty brand, was the third-most-listed brand on Amazon.com. The brand has 3,052 listings and 95.7% of those are listed by a third party. The brand’s portfolio is 96% makeup listings, 2% personal care, less than 2% skincare and less than 1% haircare.
The figure below summarizes the number of brands and products we recorded for each Amazon beauty category, and notes the three most-listed brands for each of those categories. While we identified 2,499 unique brands overall, some brands have a presence in multiple categories: For example, Maybelline New York has products in makeup, skincare and haircare.
[caption id="attachment_80267" align="aligncenter" width="580"]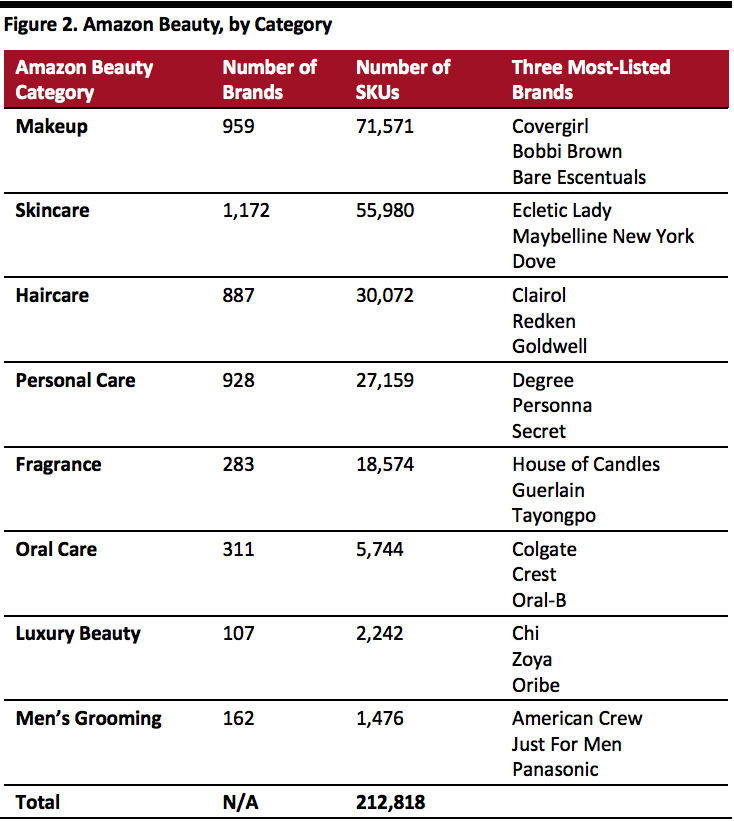 Source: DataWeave/Coresight Research[/caption]
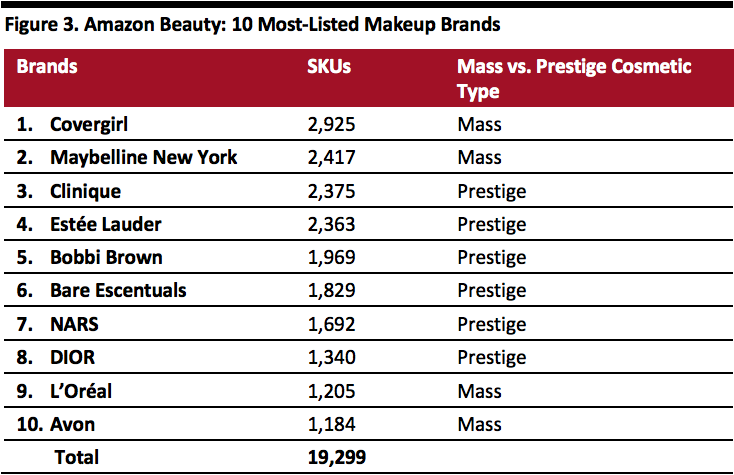
3. The top 10 makeup brands listed on Amazon account for 27% of Amazon’s makeup product listings, and the top 10 skincare brands on Amazon account for 21% of Amazon’s total skincare listings.
Within makeup, the largest beauty category on Amazon, we identified 959 unique brands and 71,571 products.
Source: DataWeave/Coresight Research[/caption]
3. The top 10 makeup brands listed on Amazon account for 27% of Amazon’s makeup product listings, and the top 10 skincare brands on Amazon account for 21% of Amazon’s total skincare listings.
Within makeup, the largest beauty category on Amazon, we identified 959 unique brands and 71,571 products.
 Source: DataWeave/Coresight Research[/caption]
Within skincare, Amazon’s second-largest beauty category, the website offers 1,172 unique brands and 55,980 products. The 10 most-listed brands on Amazon skincare account for 21% of Amazon’s skincare product listings.
Within the the ten most-listed skincare products, 42% of products are focused on body, 30% on face, 14% on the eyes, and 13% on sunscreen and tanning.
[caption id="attachment_79910" align="aligncenter" width="580"]
Source: DataWeave/Coresight Research[/caption]
Within skincare, Amazon’s second-largest beauty category, the website offers 1,172 unique brands and 55,980 products. The 10 most-listed brands on Amazon skincare account for 21% of Amazon’s skincare product listings.
Within the the ten most-listed skincare products, 42% of products are focused on body, 30% on face, 14% on the eyes, and 13% on sunscreen and tanning.
[caption id="attachment_79910" align="aligncenter" width="580"]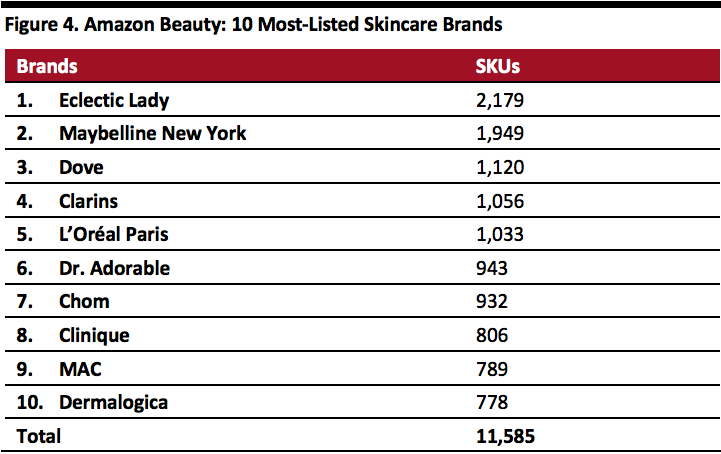 Source: DataWeave/Coresight Research[/caption]
4. Prestige brands account for 33% of total makeup listings on Amazon, yet prestige brands account for only 18% of all makeup brands.
When we analyzed the overall makeup category, we found that prestige brands accounted for only 18% of total makeup brands, but accounted for 33% of product listings.
[caption id="attachment_79911" align="aligncenter" width="580"]
Source: DataWeave/Coresight Research[/caption]
4. Prestige brands account for 33% of total makeup listings on Amazon, yet prestige brands account for only 18% of all makeup brands.
When we analyzed the overall makeup category, we found that prestige brands accounted for only 18% of total makeup brands, but accounted for 33% of product listings.
[caption id="attachment_79911" align="aligncenter" width="580"]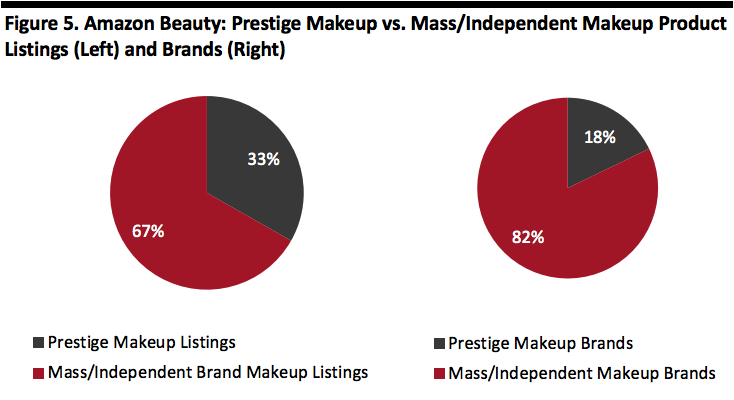 Source: DataWeave/Coresight Research[/caption]
5. Just 4% of beauty brands account for 52% of all beauty product listings.
Amazon offers a large selection in beauty, but a limited number of brands account for the bulk of this choice. This is referred to as the “long tail,” meaning out of the 2,499 brands that are represented across the eight categories, fully 316 brands (12.6%) each had just one product listed, and 682 brands (27.3% of all Amazon beauty brands), each had less than three products listed on Amazon beauty.
At the other end of the tail, just 4% of the 2,499 beauty brands that we identified on Amazon beauty (103 brands in total) listed more than 500 products each and accounted for some 52.1% of all beauty products listed on Amazon beauty.
Drilling down deeper, 38 of Amazon’s beauty brands list over 1,000 products each and accounted for 31.5% of all products on Amazon beauty.
We found a similar pattern of a few brands accounting for many of the product listings when we analyzed the Amazon fashion offering: 30 brands accounted for the majority of the clothing products listed on Amazon Fashion.
Our findings imply that there are opportunities for many beauty brands to scale up their presence on Amazon.com.
[caption id="attachment_79912" align="aligncenter" width="580"]
Source: DataWeave/Coresight Research[/caption]
5. Just 4% of beauty brands account for 52% of all beauty product listings.
Amazon offers a large selection in beauty, but a limited number of brands account for the bulk of this choice. This is referred to as the “long tail,” meaning out of the 2,499 brands that are represented across the eight categories, fully 316 brands (12.6%) each had just one product listed, and 682 brands (27.3% of all Amazon beauty brands), each had less than three products listed on Amazon beauty.
At the other end of the tail, just 4% of the 2,499 beauty brands that we identified on Amazon beauty (103 brands in total) listed more than 500 products each and accounted for some 52.1% of all beauty products listed on Amazon beauty.
Drilling down deeper, 38 of Amazon’s beauty brands list over 1,000 products each and accounted for 31.5% of all products on Amazon beauty.
We found a similar pattern of a few brands accounting for many of the product listings when we analyzed the Amazon fashion offering: 30 brands accounted for the majority of the clothing products listed on Amazon Fashion.
Our findings imply that there are opportunities for many beauty brands to scale up their presence on Amazon.com.
[caption id="attachment_79912" align="aligncenter" width="580"] Source: DataWeave/Coresight Research[/caption]
Amazon Beauty Category Listings, by First-Party vs. Third-Party Sellers
6. Third-party sellers dominate Amazon beauty, with 92.4% of beauty products listed by third-party sellers.
Third-party sellers dominate the offering on Amazon beauty. Our research found that there are a total of 179,044 third-party listings on Amazon representing fully 92.4% of all beauty products available on the site. (Note that our percentage is calculated on total product listings excluding a small proportion of items that were out of stock or for which there was a “no buy box,” meaning that consumers were unable to purchase the item.)
We found a general correlation between selling price and type of seller: Basic categories with low average selling prices see the highest representation of third-party seller units. This may suggest that Amazon is opting to focus its first-party distribution on items with higher price points and potentially higher margins.
Source: DataWeave/Coresight Research[/caption]
Amazon Beauty Category Listings, by First-Party vs. Third-Party Sellers
6. Third-party sellers dominate Amazon beauty, with 92.4% of beauty products listed by third-party sellers.
Third-party sellers dominate the offering on Amazon beauty. Our research found that there are a total of 179,044 third-party listings on Amazon representing fully 92.4% of all beauty products available on the site. (Note that our percentage is calculated on total product listings excluding a small proportion of items that were out of stock or for which there was a “no buy box,” meaning that consumers were unable to purchase the item.)
We found a general correlation between selling price and type of seller: Basic categories with low average selling prices see the highest representation of third-party seller units. This may suggest that Amazon is opting to focus its first-party distribution on items with higher price points and potentially higher margins.
 Source: DataWeave/Coresight Research[/caption]
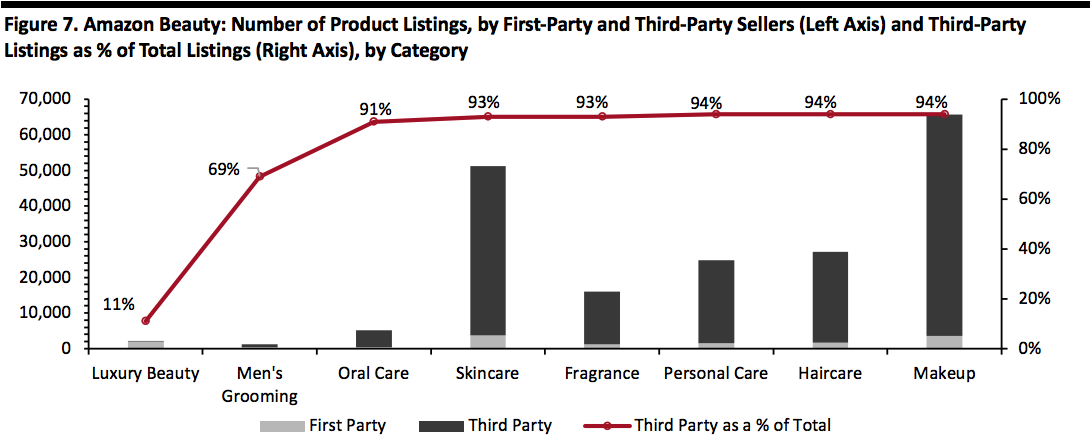
7. Luxury beauty has the highest percentage of first-party listings.
Luxury beauty was the only beauty category in which Amazon, as first-party retailer, accounted for the majority of listings. We identified a total of 2,242 listings in luxury beauty with 89% of those being first-party listings and 11% being third-party listings.
This suggests that Amazon is opting to focus its first-party distribution on higher-price point items. Within the luxury beauty category, luxury makeup, luxury nails and luxury men’s grooming were the top three categories with a first-party presence.
[caption id="attachment_79914" align="aligncenter" width="800"]
Source: DataWeave/Coresight Research[/caption]
7. Luxury beauty has the highest percentage of first-party listings.
Luxury beauty was the only beauty category in which Amazon, as first-party retailer, accounted for the majority of listings. We identified a total of 2,242 listings in luxury beauty with 89% of those being first-party listings and 11% being third-party listings.
This suggests that Amazon is opting to focus its first-party distribution on higher-price point items. Within the luxury beauty category, luxury makeup, luxury nails and luxury men’s grooming were the top three categories with a first-party presence.
[caption id="attachment_79914" align="aligncenter" width="800"]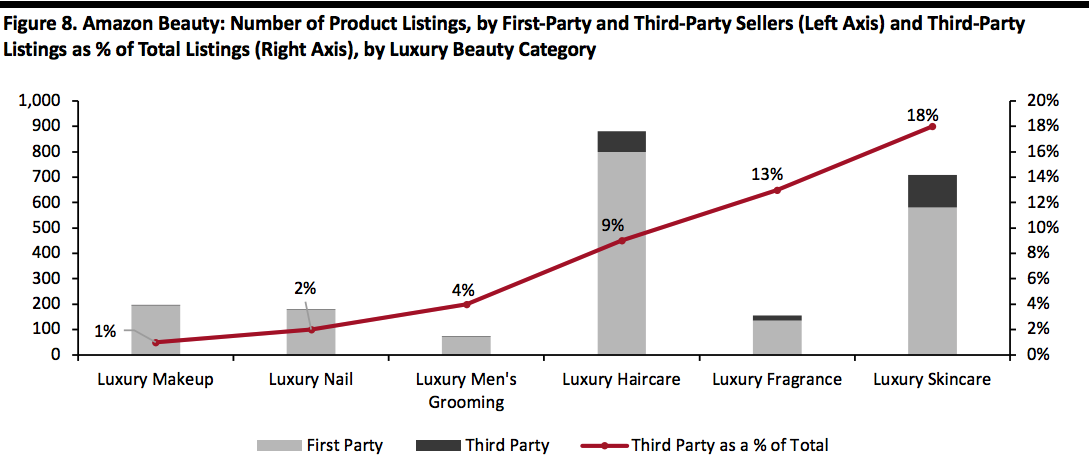 Source: DataWeave/Coresight Research[/caption]
8. Makeup has the lowest percentage of first-party listings, at only 5.5%.
Makeup sees the lowest percentage of first-party listings. We identified a total of 71,571 total makeup listings on Amazon, with only 5.5% listed for sale by Amazon itself. Makeup’s two largest categories, “body” and “lips,” also saw had the largest third-party representation, with 95% and 96% respectively.
[caption id="attachment_79915" align="aligncenter" width="800"]
Source: DataWeave/Coresight Research[/caption]
8. Makeup has the lowest percentage of first-party listings, at only 5.5%.
Makeup sees the lowest percentage of first-party listings. We identified a total of 71,571 total makeup listings on Amazon, with only 5.5% listed for sale by Amazon itself. Makeup’s two largest categories, “body” and “lips,” also saw had the largest third-party representation, with 95% and 96% respectively.
[caption id="attachment_79915" align="aligncenter" width="800"]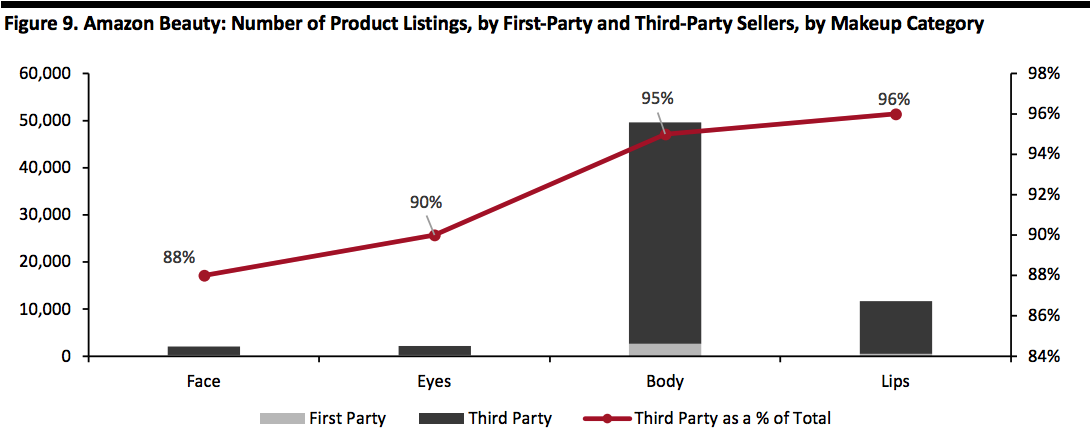 Source: DataWeave/Coresight Research[/caption]
Consumer Survey Highlights: Where Consumers are Buying Beauty
9. Amazon is the US’s second-most-shopped retailer for shopping beauty, grooming and personal care products.
To conclude our analysis of Amazon beauty, we turn to our proprietary consumer survey, undertaken in February 2019. We surveyed those US consumers who had bought beauty, grooming or personal care products in the past 12 months.
We first asked them from which retailers they had bought those categories, and found some 42.5% of shopped for these categories on Amazon.com. That made Amazon.com the second-most-shopped retailer for these categories, as measured by number of shoppers. Only Walmart recorded a higher number of beauty, grooming and personal care shoppers, with 72.4% having bought from Walmart.
[caption id="attachment_79916" align="aligncenter" width="580"]
Source: DataWeave/Coresight Research[/caption]
Consumer Survey Highlights: Where Consumers are Buying Beauty
9. Amazon is the US’s second-most-shopped retailer for shopping beauty, grooming and personal care products.
To conclude our analysis of Amazon beauty, we turn to our proprietary consumer survey, undertaken in February 2019. We surveyed those US consumers who had bought beauty, grooming or personal care products in the past 12 months.
We first asked them from which retailers they had bought those categories, and found some 42.5% of shopped for these categories on Amazon.com. That made Amazon.com the second-most-shopped retailer for these categories, as measured by number of shoppers. Only Walmart recorded a higher number of beauty, grooming and personal care shoppers, with 72.4% having bought from Walmart.
[caption id="attachment_79916" align="aligncenter" width="580"]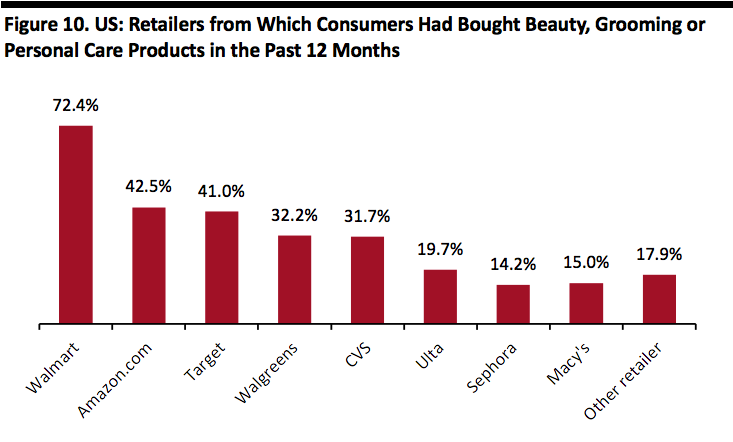 Base: US Internet users ages 18+ who have bought beauty, grooming or personal care products in the past 12 months, surveyed in February 2019
Source: Coresight Research[/caption] 10. Over half of consumers who bought beauty and personal care products on Amazon.com purchased skincare. We then asked Amazon beauty and personal care shoppers what categories they had bought on Amazon.com and found that skincare and haircare were the top categories within beauty, grooming and personal care. Just over half had purchased skincare products, which includes moisturizers, anti-agers, and hand and nail creams. Some 44.2% reported that they had purchased haircare products, which includes hair-styling products, shampoos, conditioners and colorants. We note two interesting findings from the survey data and the DataWeave product-listings data: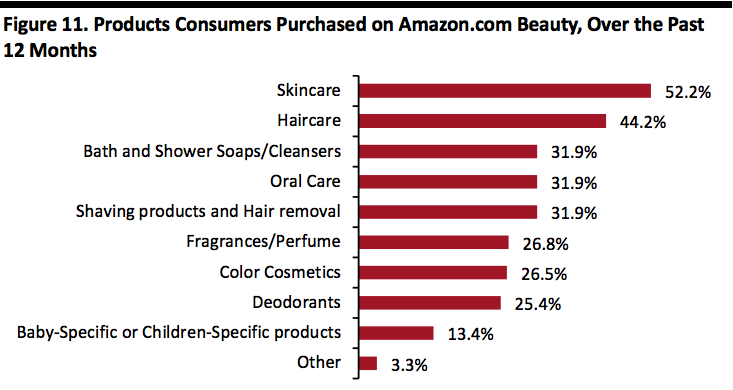 Base: US Internet users ages 18+ who have bought beauty, grooming or personal care products in the past year, surveyed in February 2019[/caption]
Key Insights
Amazon is already a major player in US retailing, but a number of data points underscore its potential for further growth.
Base: US Internet users ages 18+ who have bought beauty, grooming or personal care products in the past year, surveyed in February 2019[/caption]
Key Insights
Amazon is already a major player in US retailing, but a number of data points underscore its potential for further growth.
Source: DataWeave/Coresight Research[/caption]
2. The three most-listed brands on Amazon beauty are Maybelline New York, Clinique, and Covergirl.
We identified 2,499 unique brands spanning eight beauty and personal care categories on Amazon.com. The top three beauty brands on Amazon, by number of products listed, are Maybelline New York, Clinique and Covergirl.
Maybelline, a mass makeup brand, took the most-listed spot on Amazon. The brand has over 4,370 listings, and 94.6% of these are listed by third-party sellers and 5.4% through Amazon. As a brand, Maybelline sells across multiple categories – with nearly 55% of its listings in makeup, 44% in skincare and a few listings in haircare.
Clinique is the second-most-listed brand. A prestige brand with mass appeal, Clinique offers over 3,277 listings on Amazon.com and 97.7% of its products listings are listed by third-party sellers. The brand’s primary presence on Amazon.com is in makeup, with 72% of its products on Amazon in this category, plus 25% in skincare, 3% in personal care, and less than 1% in haircare.
Covergirl, a mass beauty brand, was the third-most-listed brand on Amazon.com. The brand has 3,052 listings and 95.7% of those are listed by a third party. The brand’s portfolio is 96% makeup listings, 2% personal care, less than 2% skincare and less than 1% haircare.
The figure below summarizes the number of brands and products we recorded for each Amazon beauty category, and notes the three most-listed brands for each of those categories. While we identified 2,499 unique brands overall, some brands have a presence in multiple categories: For example, Maybelline New York has products in makeup, skincare and haircare.
[caption id="attachment_80267" align="aligncenter" width="580"] Source: DataWeave/Coresight Research[/caption]
3. The top 10 makeup brands listed on Amazon account for 27% of Amazon’s makeup product listings, and the top 10 skincare brands on Amazon account for 21% of Amazon’s total skincare listings.
Within makeup, the largest beauty category on Amazon, we identified 959 unique brands and 71,571 products.
- The 10 most-listed makeup products account for 27% of Amazon’s makeup product listings.
- Of the top ten makeup brands, we identified that 60% are prestige cosmetics and 40% are mass cosmetics.
- Within the makeup category, nearly 79% of Amazon’s products refer to makeup that one uses for the face or body, 18% of products are for lips, and 3% are for eyes.
Source: DataWeave/Coresight Research[/caption]
Within skincare, Amazon’s second-largest beauty category, the website offers 1,172 unique brands and 55,980 products. The 10 most-listed brands on Amazon skincare account for 21% of Amazon’s skincare product listings.
Within the the ten most-listed skincare products, 42% of products are focused on body, 30% on face, 14% on the eyes, and 13% on sunscreen and tanning.
[caption id="attachment_79910" align="aligncenter" width="580"] Source: DataWeave/Coresight Research[/caption]
4. Prestige brands account for 33% of total makeup listings on Amazon, yet prestige brands account for only 18% of all makeup brands.
When we analyzed the overall makeup category, we found that prestige brands accounted for only 18% of total makeup brands, but accounted for 33% of product listings.
[caption id="attachment_79911" align="aligncenter" width="580"] Source: DataWeave/Coresight Research[/caption]
5. Just 4% of beauty brands account for 52% of all beauty product listings.
Amazon offers a large selection in beauty, but a limited number of brands account for the bulk of this choice. This is referred to as the “long tail,” meaning out of the 2,499 brands that are represented across the eight categories, fully 316 brands (12.6%) each had just one product listed, and 682 brands (27.3% of all Amazon beauty brands), each had less than three products listed on Amazon beauty.
At the other end of the tail, just 4% of the 2,499 beauty brands that we identified on Amazon beauty (103 brands in total) listed more than 500 products each and accounted for some 52.1% of all beauty products listed on Amazon beauty.
Drilling down deeper, 38 of Amazon’s beauty brands list over 1,000 products each and accounted for 31.5% of all products on Amazon beauty.
We found a similar pattern of a few brands accounting for many of the product listings when we analyzed the Amazon fashion offering: 30 brands accounted for the majority of the clothing products listed on Amazon Fashion.
Our findings imply that there are opportunities for many beauty brands to scale up their presence on Amazon.com.
[caption id="attachment_79912" align="aligncenter" width="580"] Source: DataWeave/Coresight Research[/caption]
Amazon Beauty Category Listings, by First-Party vs. Third-Party Sellers
6. Third-party sellers dominate Amazon beauty, with 92.4% of beauty products listed by third-party sellers.
Third-party sellers dominate the offering on Amazon beauty. Our research found that there are a total of 179,044 third-party listings on Amazon representing fully 92.4% of all beauty products available on the site. (Note that our percentage is calculated on total product listings excluding a small proportion of items that were out of stock or for which there was a “no buy box,” meaning that consumers were unable to purchase the item.)
We found a general correlation between selling price and type of seller: Basic categories with low average selling prices see the highest representation of third-party seller units. This may suggest that Amazon is opting to focus its first-party distribution on items with higher price points and potentially higher margins.
- Luxury beauty sees the highest percentage of first-party listings, at 89%.
- The makeup category sees the lowest proportion of first-party listings, at only 5%.
- Within men’s grooming, first-party listings account for 31% of all listings with 69% of products listed by third-party sellers.
Source: DataWeave/Coresight Research[/caption]
7. Luxury beauty has the highest percentage of first-party listings.
Luxury beauty was the only beauty category in which Amazon, as first-party retailer, accounted for the majority of listings. We identified a total of 2,242 listings in luxury beauty with 89% of those being first-party listings and 11% being third-party listings.
This suggests that Amazon is opting to focus its first-party distribution on higher-price point items. Within the luxury beauty category, luxury makeup, luxury nails and luxury men’s grooming were the top three categories with a first-party presence.
[caption id="attachment_79914" align="aligncenter" width="800"] Source: DataWeave/Coresight Research[/caption]
8. Makeup has the lowest percentage of first-party listings, at only 5.5%.
Makeup sees the lowest percentage of first-party listings. We identified a total of 71,571 total makeup listings on Amazon, with only 5.5% listed for sale by Amazon itself. Makeup’s two largest categories, “body” and “lips,” also saw had the largest third-party representation, with 95% and 96% respectively.
[caption id="attachment_79915" align="aligncenter" width="800"] Source: DataWeave/Coresight Research[/caption]
Consumer Survey Highlights: Where Consumers are Buying Beauty
9. Amazon is the US’s second-most-shopped retailer for shopping beauty, grooming and personal care products.
To conclude our analysis of Amazon beauty, we turn to our proprietary consumer survey, undertaken in February 2019. We surveyed those US consumers who had bought beauty, grooming or personal care products in the past 12 months.
We first asked them from which retailers they had bought those categories, and found some 42.5% of shopped for these categories on Amazon.com. That made Amazon.com the second-most-shopped retailer for these categories, as measured by number of shoppers. Only Walmart recorded a higher number of beauty, grooming and personal care shoppers, with 72.4% having bought from Walmart.
[caption id="attachment_79916" align="aligncenter" width="580"] Base: US Internet users ages 18+ who have bought beauty, grooming or personal care products in the past 12 months, surveyed in February 2019Source: Coresight Research[/caption] 10. Over half of consumers who bought beauty and personal care products on Amazon.com purchased skincare. We then asked Amazon beauty and personal care shoppers what categories they had bought on Amazon.com and found that skincare and haircare were the top categories within beauty, grooming and personal care. Just over half had purchased skincare products, which includes moisturizers, anti-agers, and hand and nail creams. Some 44.2% reported that they had purchased haircare products, which includes hair-styling products, shampoos, conditioners and colorants. We note two interesting findings from the survey data and the DataWeave product-listings data:
- Some 44.2% of Amazon beauty shoppers have bought haircare on the site while only 13.5% of its beauty listings are devoted to haircare, suggesting an opportunity for haircare brands.
- Although makeup represents over 34% of Amazon’s beauty product listings, 26.5% of Amazon beauty shoppers had bought “color cosmetics” on the site in the past 12 months, suggesting that the category may be overserved.
Base: US Internet users ages 18+ who have bought beauty, grooming or personal care products in the past year, surveyed in February 2019[/caption]
Key Insights
Amazon is already a major player in US retailing, but a number of data points underscore its potential for further growth.
- Some 12.6% of Amazon beauty brands list only one product. These data suggest there are opportunities for beauty brands to scale up and for brands to grow.
- Amazon beauty is heavily reliant on third-party sellers, with 92.4% of its beauty listings from third parties. Luxury beauty sees the highest percentage of first-party listings, suggesting that Amazon is opting to focus its first-party distribution on items with higher price points and potentially higher margins.
- We think more first-party listings could encourage shoppers, and especially Prime members, to buy more beauty on the Amazon site. Shopppers may feel more trust and assurance if they are benefitting from Amazon’s delivery and returns policies. As Amazon’s beauty continues to grow and as the company builds collaborations with brands, we expect to see more first-party listings on the site.
- Our recent consumer survey confirms the popularity of Amazon for beauty and personal care categories: Our data indicate that it is now the most-shopped seller of beauty and personal care products in the US, by number of shoppers.
- We defined our universe of brands by aggregating data on the top featured product listings on Amazon Beauty on Amazon’s US beauty site.
- This returned a total of 2,499 unique brands featured on Amazon beauty.
- We then aggregated data on all product listings for each of those 2,499 brands, by product type.
- We identified a total of 212,818 individually listed products.
- We conducted our research between February 1 and February 28, 2019.