albert Chan
Introduction
What’s the Story?
This is our fifth annual survey of clothing and footwear shoppers with a focus on Amazon as a fashion retailer. We have conducted an annual survey of US consumers since 2018, to shed light on their clothing and footwear (collectively referred to as “apparel” in this report) shopping patterns and habits from Amazon. The multiyear consistency of many of the questions has enabled us to determine both emerging and established trends.
Our survey was undertaken in February 2022, after the Covid-19 lockdowns began to be phased out and physical stores became fully operational. This report will discuss our survey findings, question by question, and key insights from cumulative data from our five years of survey data.
Why It Matters
Amazon supplanted Walmart as the most-shopped apparel retailer in the US in 2019, according to our data. In a highly competitive marketplace, thoroughly reshaped by the impacts of the pandemic, consumers are increasingly comfortable alternating between online and in-store channels in search of better prices and quality products—allowing Amazon’s private-label apparel products to thrive on price and speed.
Amazon Apparel US Consumer Survey 2022: Coresight Research Analysis
1. Reversal of Trends in “Have Bought” and “Expect to Buy”
After a dip in 2021, when the ongoing pandemic had, in the prior 12 months, decreased overall apparel sales, the proportion of consumers purchasing apparel from Amazon rose by 6.7 PPTs this year to 70.4%. However, that returns shopper levels only to those we recorded in early 2020 (that captured activity in the 12 months before the pandemic); that flatlining contrasts with a consistent trend in prior years of increased numbers of consumers buying apparel on Amazon each year.
Meanwhile, the proportion of consumers expecting to buy apparel on the e-commerce platform jumped by 7.5 PPTs to 66.0% from 58.5% a year earlier.
The proportion of shoppers expecting to buy apparel from Amazon in the next 12 months began to fall from 2021. Since 2020, the proportion of shoppers who had bought apparel from Amazon in the past 12 months has exceeded the proportion expecting to buy in the next 12 months. The divergence stood at 5.2 PPTs in 2021 and 3.4 PPTs in 2022, reversing the trend in 2018–2019, when those expecting to shop outnumbered those having bought apparel on Amazon.
Figure 1. Apparel Shoppers: Proportion That Have Bought/Expect To Buy Apparel from Amazon (% of Respondents) [caption id="attachment_148586" align="aligncenter" width="700"]
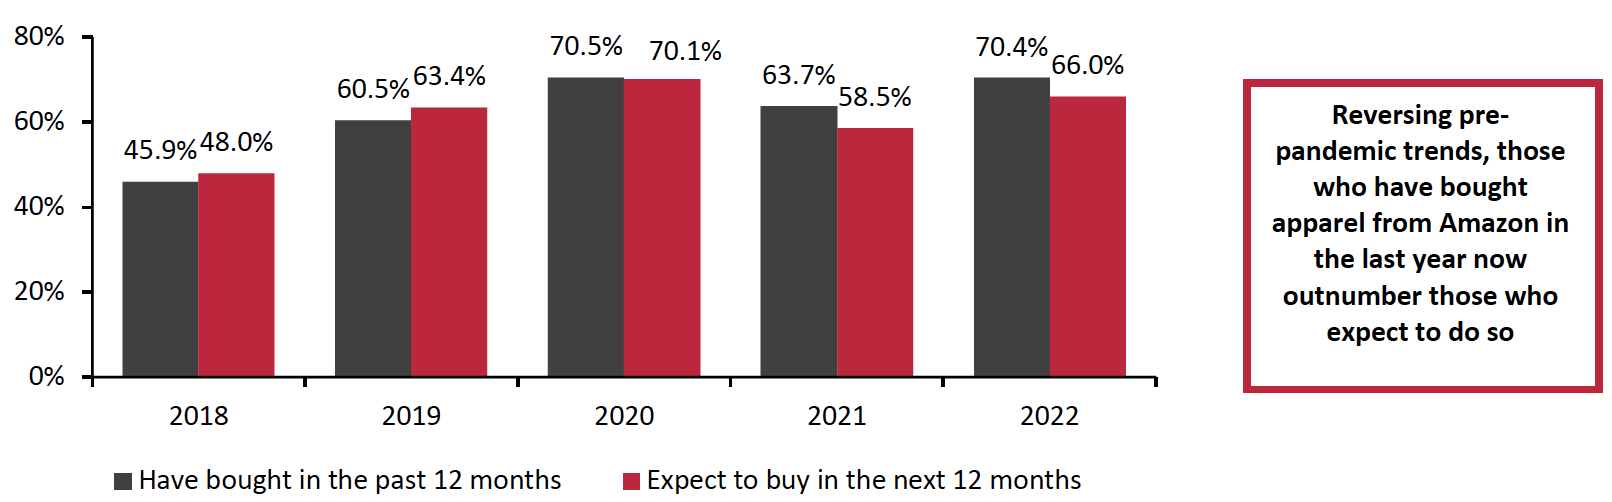 Base: US consumers aged 18+ who had purchased apparel in the preceding 12 months (1,564 in 2018; 1,618 in 2019; 1,855 in 2020; 1,818 in 2021; and 1,999 in 2022)
Source: Coresight Research[/caption] Where Consumers Have Switched From Some 26.7% of Amazon apparel shoppers reported that they spend more of their apparel budget with Amazon than they did a year previously—implying that they have switched spending away from other apparel retailers. We then asked that subset of respondents where they had switched spend from. The highest levels of switching are from mass retailers such as Walmart and Target and mid-priced department stores such as Kohl’s and JCPenney. These trends in part reflect those companies’ prominence in the apparel market—Walmart, Target and Kohl’s are in second, third and fourth place after Amazon, by number of shoppers (see later in this report for the ranking). It could imply that US consumers are still drawn to Amazon primarily for its competitive prices.
Figure 2. Shoppers Who Spend More of Their Apparel Budget with Amazon Than 12 Months Prior: Where They Have Switched Spending From (% of Respondents) in 2021-2022
[caption id="attachment_148587" align="aligncenter" width="700"]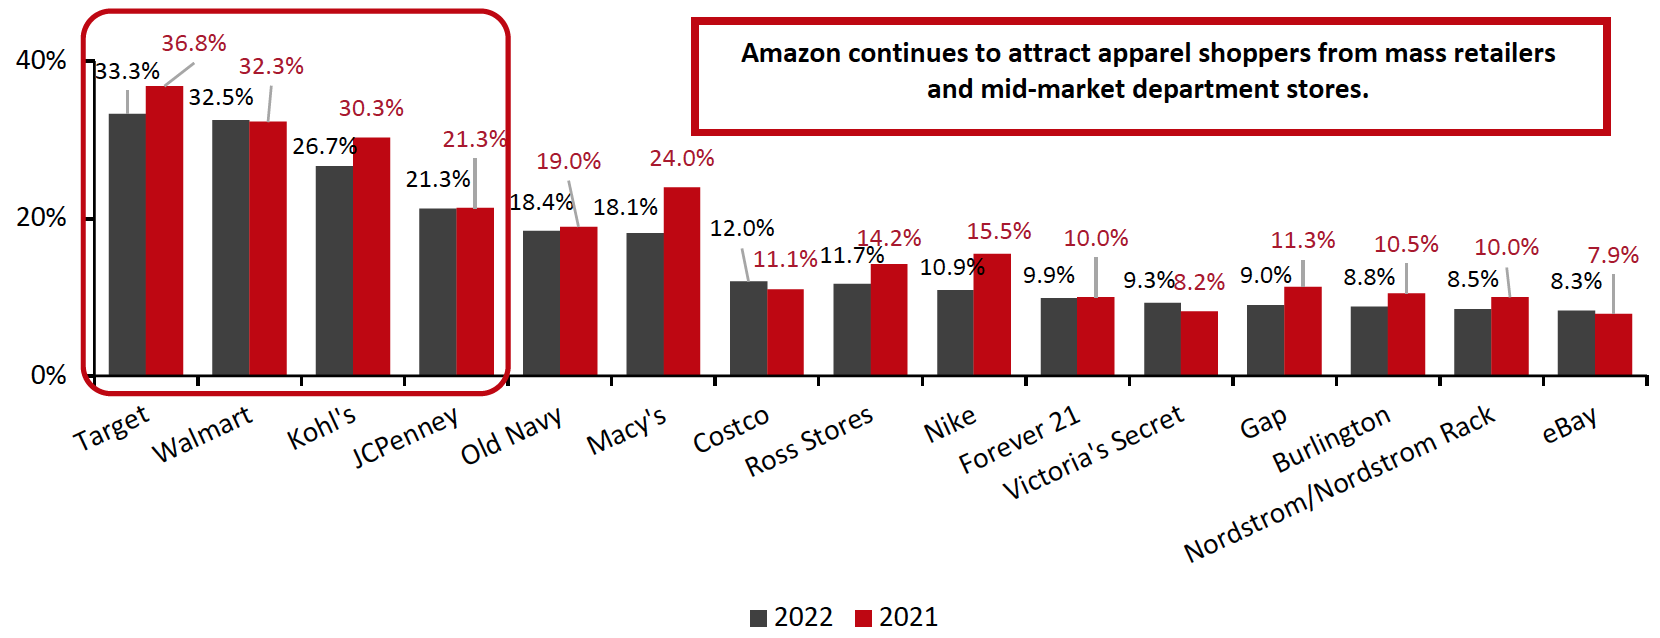 Base: US consumers aged 18+ who spent more on apparel with Amazon than 12 months previously
Source: Coresight Research[/caption]
2. Footwear and Casual Wear Remain Top While Formal Clothing Continues Its Striking Rise
Our five years of survey data reveal little fluctuation in the categories shoppers are buying from Amazon. Footwear and casual clothing remain the most sought-after items. In our five years of survey data, the proportion buying adult footwear, consistently the most popular category (43% in 2022), has never dipped below 40%. In second and third place, women’s casual apparel consistently exceeds men’s casual apparel.
Slowly and steadily, however, shoppers are expanding their purchases into other categories. Notably, the proportion buying formal clothing from Amazon rose from 9.3% in 2018 to a high of 15.1% in 2020—a level to which it nearly recovered this year, reaching 14.6%. Amid an overall decline in sales of formal wear, this increase in the proportion of consumers buying formal clothing through Amazon may indicate shoppers seeking out more affordable formal items as their total spending on the category decreases—to Amazon’s benefit.
The top three categories (adult footwear, women’s casual apparel and men’s casual apparel) saw a dip in pandemic-impacted 2021, from which they partly recovered this year. The same pattern is seen in formal clothing and men’s and women’s jackets and coats—categories that include bigger-ticket items. Conversely, the proportion buying in the generally cheaper categories of underwear, socks and hosiery and sports clothing increased in 2021, and remained broadly stable this year.
Figure 3. Amazon Apparel Shoppers: Categories Purchased (% of Respondents)
[wpdatatable id=2032] US consumers aged 18+ who had purchased apparel from Amazon in the preceding 12 months (719 in 2018; 985 in 2019; 1,308 in 2020; 1,158 in 2021; and 1,407 in 2022) Source: Coresight Research3. Amazon Emerges as a Popular Apparel Brand
Amazon’s own apparel private labels continue to capture share. Having overtaken Under Armour two years ago, Amazon’s private labels supplanted NIKE this year, to become the most-purchased brand. Amazon’s control of the online store floor and the cost of supply chains have made its own apparel more visible and affordable. On their own e-commerce platform, the world’s largest, Amazon’s private labels have grown formidable enough to outcompete international brands.
Amazon does not disclose private-labels sales. However, in 2020, Amazon’s private brands made up 9% of its sales of clothing, shoes and accessories on Amazon, according to Jeff Bezos, its founder and then-CEO, who disclosed some data in his testimony during a Congressional anti-trust hearing.
Despite its high-profile decision in November 2019 to stop selling directly through Amazon, NIKE remains the second most-bought apparel brand on the e-commerce platform, highlighting the sportwear brand’s persistent dependence on third-party retailers—a dependence Amazon now exploits.
Figure 4. Amazon Apparel Shoppers: Brands Purchased (% of Respondents)
[wpdatatable id=2033] US consumers aged 18+ who had purchased apparel from Amazon in the preceding 12 months (705 in 2018; 985 in 2019; 1,308 in 2020; 1,158 in 2021; and 1,407 in 2022) Source: Coresight Research4. Speed, Value and Wider Choice Drive Apparel Sales on Amazon
Apparel shoppers are drawn to Amazon for speed, choice and value. Our five years of survey data consistently show fast and free shipping, through Prime, is the biggest driver of Amazon’s apparel sales, with more than 60% citing it as their reason for shopping on the site this year. The proportion who shop with Amazon because they find the website easy to browse has declined from two-thirds in 2018 to 49.7% in 2022. Wide product availability—such as of sizes and colors—was cited by more shoppers (42.7%) than wide brand availability (37.5%) as a reason to purchase from Amazon. Some 37.1% reported shopping with Amazon because it offers good value.
All these suggest that Amazon apparel shoppers prioritize speed and price-effectiveness over brand loyalty. This is also supported by the rising popularity of Amazon’s private-label products—the most-bought brand of 2022. Only 8.5% of shoppers cited Amazon’s private labels as a reason to choose the retailer, suggesting that many shoppers who browsed on Amazon because of its range of products and brands ultimately bought private labels. Amazon thus appears to be succeeding at converting shoppers to its private labels.
Figure 5. Amazon Apparel Shoppers: Why They Choose Amazon (% of Respondents)
[wpdatatable id=2034] US consumers aged 18+ who had purchased apparel from Amazon in the preceding 12 months (705 in 2018; 985 in 2019; 1,308 in 2020; 1,158 in 2021; and 1,407 in 2022) Source Coresight Research5. What Amazon’s Apparel Shoppers Expect
Amazon’s apparel shoppers expect the online platform to keep on providing what it has been already offering, although perceptions of the retailer are shifting in some respects. Less than one-third (31.6%) of shoppers now expect to buy apparel on Amazon at less than full price, down from almost half (49.7%) in 2018. Free shipping, by contrast, has remained relatively stable as a major incentive for shoppers to buy apparel on Amazon: 30% in 2022 versus 34.5% in 2018.
Fewer shoppers now expect to buy more apparel from Amazon in the coming years: That proportion has fallen to 25.4% in 2022 from 35% in 2020 during the peak of the pandemic, suggesting that Amazon will likely face stiffer competition from mass retailers and other emerging apparel platforms such as Shein.
With almost one-quarter of Amazon apparel shoppers now naming the platform as their favorite apparel destination, Amazon has solidified its status as an apparel retailer. However, interest in its private brands has fluctuated over the last five years, falling from 27.2% in 2020 to 18.5% in 2022—returning to levels seen in 2018. This likely implies recent growth in the sales of its private labels has yet to translate into a solid brand image or brand recognition.
Figure 6. Amazon Apparel Shoppers: Attitudes to Amazon.com (% of Respondents)
[wpdatatable id=2035] US consumers aged 18+ who had purchased apparel from Amazon in the preceding 12 months (705 in 2018; 985 in 2019; 1,308 in 2020; 1,158 in 2021; and 1,407 in 2022)6. Where (Else) and How Clothing and Footwear Shoppers Shop
In the table below, we show the proportion of all respondents that said that they purchased apparel at any of a selection of major retailers. Amazon supplanted Walmart as the most-shopper retailer for clothing and footwear in 2019, according to our surveys. The Chinese fast-fashion e-commerce retailer Shein (included in our survey for the first time this year) has already outranked H&M and Nordstrom/Nordstrom Rack in shopper penetration, using a variety of social media platforms to target younger shoppers. Shein could make further headway in the US due to its data-driven manufacturing system.
The data included in Figure 1 and Figure 7 originate from different survey question formats, which is why data points differ.
- Read more about Shein’s prospects in the US in our separate report, Shein in US Fast Fashion: The Multibillion-Dollar Apparel Giant Captures Share Among Young Shoppers
Figure 7. Apparel Shoppers: Where They Have Purchased Apparel in the Past 12 Months (% of Respondents)
[wpdatatable id=2036] Base: US consumers aged 18+ who had purchased apparel in the preceding 12 months (1,564 in 2018; 1,618 in 2019; 1,855 in 2020; 1,818 in 2021; and 1,999 in 2022) Respondents were free to select any options from a list of major retailers; this was a different format from the yes/no question format used to definitively establish whether respondents had bought apparel on Amazon (shown in Figure 1) Source: Coresight ResearchThis year, 65.5% of US shoppers reported buying apparel both online and in-store. The proportion buying apparel exclusively online fell by 8 PPTs, to 19.7% in 2022 from 27.7% in 2021. The proportion shopping exclusively in-store remained around 14%—meaning brick-and-mortar apparel retailers did not entirely win back the shoppers they lost to Amazon and other e-commerce platforms during the pandemic.
US consumers appear to have become hybrid shoppers who proactively seek better price and quality by exploring both physical and online options. This trend is also reflected in where Amazon apparel shoppers have switched their spending from (Figure 2).
Figure 8. Apparel Shoppers: Channels Used To Purchase Apparel (% of Respondents)
[caption id="attachment_148592" align="aligncenter" width="700"] US consumers aged 18+ who had purchased apparel in the preceding 12 months (1,855 in 2020; 1,818 in 2021; and 1,999 in 2022)
Source: Coresight Research[/caption]
What We Think
- Amazon has consolidated its position as a full-fledged apparel retailer with strength in pricing and logistics. The e-commerce platform is in particular competition with mass retailers and department stores.
- Apparel shoppers put price, quality and speed ahead of their loyalty for stores or brands as they more frequently shuttle between in-store and online to meet their apparel needs better, more affordably and faster.
- The latest rise in popularity of Amazon’s private labels may be because these labels conformed to such needs. To sustain growth in its private-label apparel range, Amazon will need to build up brand recognition and loyalty based upon its strengths, including affordable prices and affordable or free and speedy delivery.
Methodology
Informing the data in this report are Coresight Research’s annual Amazon apparel surveys of US consumers online, conducted in February 2022 (2,138 respondents), March 2021 (2,006 respondents), February 2020 (1,934 respondents), February 2019 (1,732 respondents) and late January 2018 (1,699 respondents).