DIpil Das
What’s the Story?
At Kohl’s, activist investors together hold 9.5% of the company’s stock. Activist investors Ancora Holdings Inc., Legion Partners Asset Management and Macellum Advisors participated in a 2019 Bed Bath & Beyond initiative to turn around its business. These investors, with the addition of 4010 Capital, form the “Investor Group” at Kohl’s. The group submitted a letter to Kohl’s at the company’s 2021 annual meeting of shareholders, which states that “poor retail execution and strategy have led to stagnant sales and declining operating margins.”
Activist investors are generally viewed as disruptive and unwelcome by those within the target company’s management team, as activist agendas usually seek to change the company’s strategic direction, corporate teams and policies. The activist investors at Kohl’s are pushing for a controlling slate of nine directors for election to the company’s Board of Directors. Proposed changes to increase profitability include “changes in merchandising, inventory management, customer engagement and expense rationalization, as well as the potential to unlock $7–8 billion of real estate value trapped on the company’s balance sheet.” The investors are proposing a sale leaseback program.
Kohl’s officially rebutted this letter on February 22, 2021, “rejecting the Investor Group’s attempt to seize control of its Board and disrupt its momentum.” The company also affirmed its October 2020 Strategic Plan to drive top-line growth in the following key areas: building a beauty business with Sephora, growing an active business to 30% of sales, investing in omnichannel to increase productivity and expanding operating margin to 7–8% through efforts across gross margin and SG&A (selling, general and administrative expense) efficiency.
In this report, we analyze selected key metrics that the Investor Group identified in its assessment of Kohl’s: revenue and market share; profitability; and sale and leaseback potential. We compare them to the performance of the largest department store chain in the US and Kohl’s competitor, Macy’s.
Activist Investors Seek Change at Kohl’s: An Analysis of Metrics and a Benchmark to Industry
Activist investing is strategic, looking at both the target company’s performance and its composition of shareholders to begin the process executing change. There are two key considerations in activist investing:
- Feasibility—Investors assess composition of shareholders to ascertain whether there is an opportunity to impact change by changing the ownership profile. To illustrate with an example, nearly 30% of Nordstrom’s common shares are closely held by individuals and members of the Nordstrom family, so it would be difficult to accumulate a larger majority holding for activist investing. Activist investment is therefore a multi-pronged approach where investors gain enough capital to have a voice and potentially take control of strategic direction.
- Company performance—Investors assess performance across key metrics, most notably regarding profitability.
Below, we analyze three metrics that the activist investors applied in the Kohl’s case, offering a side-by-side comparison of Kohl’s and Macy’s. Macy’s is a competitor of Kohl’s; the majority of its investors are passive (large mutual funds that own common stock to mimic index returns)—insiders hold a relatively small percentage of Macy’s shares—so while we are not making a recommendation, the company could be eligible for activist investing.
1. Revenue and Market Share
According to the Investor Group, Kohl’s had stagnant sales, which led to a loss of market share. As shown in Figure 1, Kohl’s revenue increased from $18.4 billion in fiscal 2010 to $20.0 billion in fiscal 2019; Macy’s revenue increased from $25.0 billion to $25.3 billion in the same time period.
Figure 1. Macy’s Company Revenue and Kohl’s Revenue (USD Bil.; Left Axis) and YoY % Change (Right Axis) [caption id="attachment_123697" align="aligncenter" width="700"]
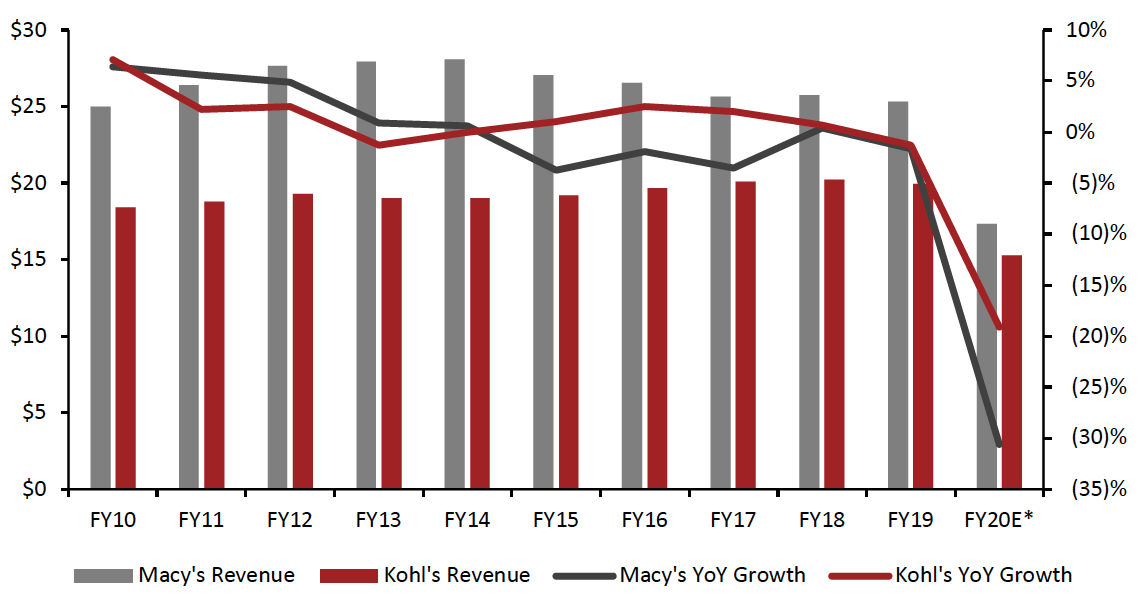 *FY20 figures are actuals reported on February 23, 2021; FY20 figures for Kohl’s are estimates
Macy’s revenue includes Bloomingdale’s and Bluemercury
Source: Company reports[/caption]
As Kohl’s is one of the best performing department stores in a sector that has been declining, the Investor Group’s assessment that the company is losing market share is likely comparing its performance to the overall retail market, which includes e-commerce marketplaces such as Amazon and specialty apparel retailers. In the context of the overall competitive retail landscape, this is an accurate assessment.
However, as shown in Figure 2, Kohl’s has gained market share within the department store sector, from 17.6% in 2015 to 23.8% in 2020, according to Euromonitor International. Macy’s has seen its market share grow from 23.4% to 24.2%.
Figure 2. US Department Store Market: Top Retailers (% Share)
[caption id="attachment_123680" align="aligncenter" width="700"]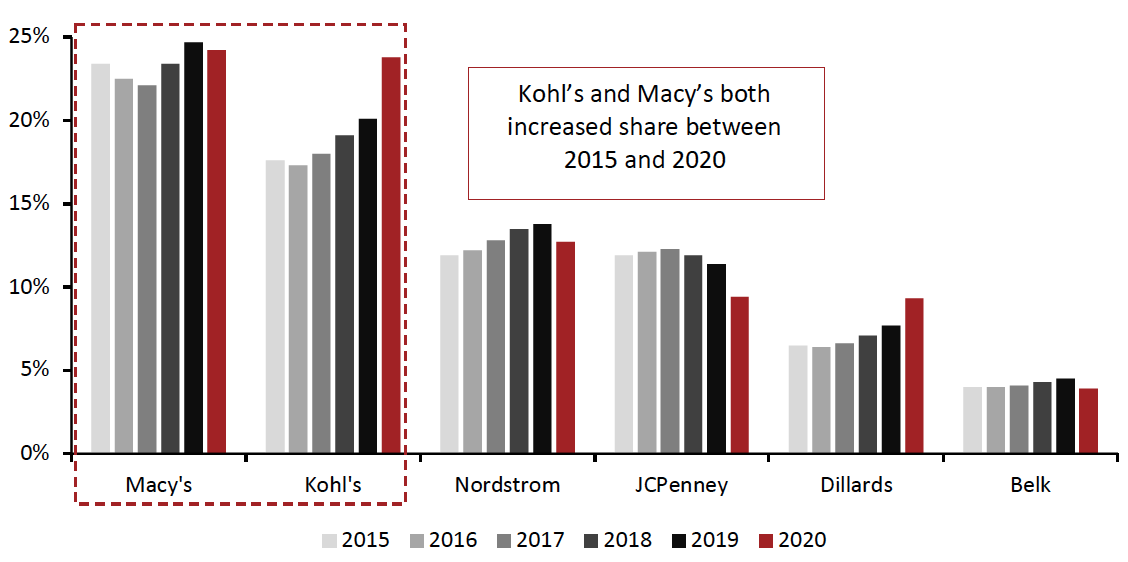 Source: Euromonitor International Limited 2021 © All rights reserved[/caption]
2. Profitability
The Investor Group analyzed profitability at Kohl’s. As shown in Figure 3, the company’s operating margins declined from 11.4% in fiscal 2010 to 6.1% in fiscal 2019. Although Macy’s saw operating margins peak at 10.2% in fiscal 2014—increasing from 7.7% in fiscal 2010—the company has also seen a declining trend over past few years, with operating margin reaching a low of 4.7% in fiscal 2019.
Both retailers have large store fleets, with rent and operational store costs being the largest expense drivers. In addition, revenues have been pressured by a decrease in mall and store traffic amid a consumer preference shift to the digital channel.
Figure 3. Kohl’s and Macy’s Operating Margins (Earnings Before Income and Taxes) [caption id="attachment_123681" align="aligncenter" width="700"]
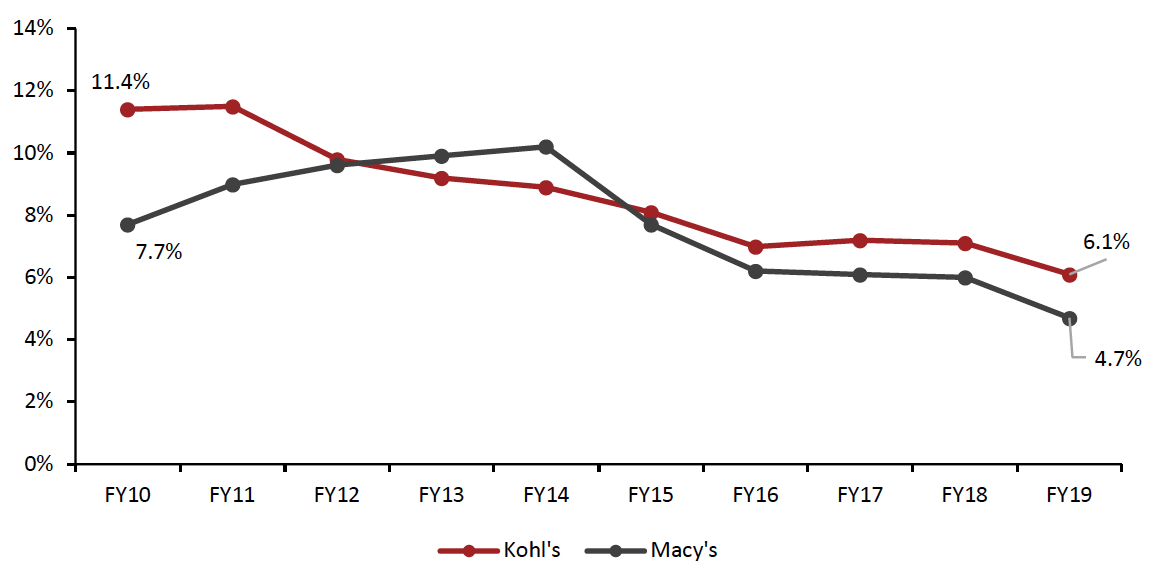 Source: Company reports[/caption]
3. Lease Buyback Potential
The activist investors at Kohl’s are targeting the sale and leaseback of the company’s physical stores to infuse some cash back into the business. As shown in Figure 4, 35.5% of the retailer’s 1,159 stores are owned, as reported in its most recent 10-K earnings report for the fiscal year ended February 1, 2020. The Investor Group reported that it could generate up to “$3 billion of real estate value” in a sale and leaseback program, from “$7–8 billion of real estate value trapped on the company’s balance sheet.”
A leaseback program would allow Kohl’s to essentially sell the assets it owns and lease them back, freeing up some cash for other investments in the business. However, these benefits would likely be short-term, as locking Kohl’s into longer-term leases in an environment of uncertain and fast-changing demand presents future risk.
Figure 4. Kohl’s Stores: Owned vs. Leased
[caption id="attachment_123682" align="aligncenter" width="700"]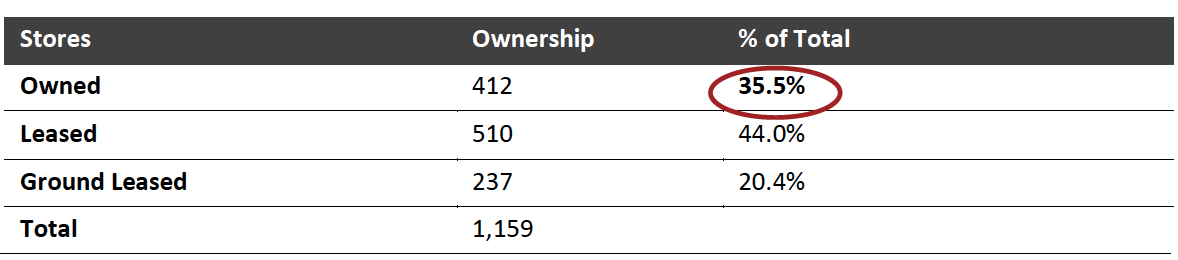 Source: Company reports[/caption]
For Macy’s, 40.7% of its 839 stores are owned, as of its 10-K dated February 2, 2020 (see Figure 5). This equates to over 120 million square feet of retail space. In addition, the company’s property values are of note, with its Macy’s Herald Square flagship store (2.5 million square feet) is valued at $3–4 billion. The company’s portfolio has been valued at between $16 billion (by Cowen Investment Bank in 2017) and $20.7 billion (by Starboard Value). The property values at Macy’s could be of considerable interest to investors, as the company’s market ›capitalization is $4.7 billion as of February 22, 2021: The retailer’s property values are in excess of its market capitalization.
[caption id="attachment_123683" align="aligncenter" width="700"]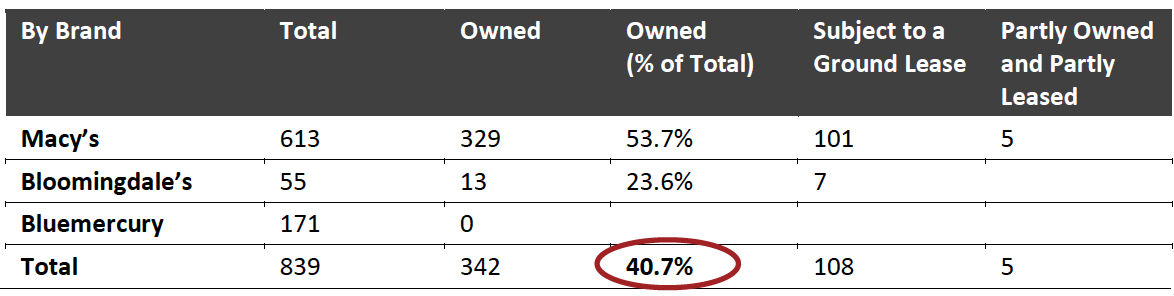 Source: Company reports[/caption]
Leveraging a company’s retail real estate is one component of looking at the entire business and is another lever that retailers may be able to draw upon to generate cash in the short term. Both Kohl’s and Macy’s have a solid physical store portfolio, of which they own 36% and 41%, respectively. Taking a holistic view of their retail busines includes how best to use these physical assets, which includes their value. This is most notable for Macy’s, as the company has half the stores of Kohl’s but twice the square footage. Macy’s has continued to optimize its fleet as another way to save operating costs: In February 2020, the company announced plans to close 125 of its least efficient stores over three years.
The downside of a sale and leaseback program is that the company would need to pay rent on the new facilities—representing a new expense. The benefits of the program include the influx from the initial sale. This can be considered a viable option for some owned assets, particularly as department stores are seeking to invest in other capabilities such as digital, which can help the core retailing business.
What We Think
Macy’s and Kohl’s, the number-one and number-two department stores in the US, respectively, demonstrate similar performance when assessed according to Kohl’s Investor Group criteria:
- Revenue has grown at a 1% CAGR at Kohl’s between fiscal 2010 and fiscal 2019, from $18.4 billion to $20.0 billion, while Macy’s grew at 0.1% CAGR from $25.0 billion to $25.3 billion over the same period.
- Kohl’s and Macy’s have both improved their share of the US department store sector since 2015. Kohl’s increased its share from 17.6% in 2015 to 23.8% in 2020, while Macy’s saw it share grow from 23.4% to 24.2% in the same period.
- Both department store chains have experienced operating margin contraction in recent years—Kohl’s from 11.4% in fiscal 2010 to 6.1% in fiscal 2019, and Macys from 7.7% to 4.7% over the same period.
Real estate is the biggest short-term opportunity for retailers to inject cash into their operations to fund other opportunities. This could include digital expansion, partnerships to drive traffic or other innovations. Within their physical portfolios, 35.5% of Kohl’s stores are owned and 40.7% of Macy’s stores are owned. Macy’s in particular has lucrative real estate, with expansive urban stores; its flagship Macy’s store is valued at $3–4 billion. Sale and leaseback provides a one-time influx of cash, and in the case of activist investing, this cash could be used to pay out dividends, for example.
Source for all Euromonitor International data: Euromonitor International Limited 2021 © All rights reserved