
albert Chan
Each year, the IRS reports tax return filings and refunds on a weekly basis, starting at the end of January until the April 15 deadline. In this report, we look at what happened in the first week of the 2020 tax filing season.
The IRS kicked off the 2020 tax filing season on January 27 when it began accepting tax returns for 2019. The IRS expects to process over 150 million individual tax returns in 2020, and that most will be filed before the April 15 deadline.
The IRS made several interesting changes this year:
 Source: IRS[/caption]
The graph below shows total refunds increasing at a 1.2% CAGR during 2015-2019.
[caption id="attachment_103571" align="aligncenter" width="700"]
Source: IRS[/caption]
The graph below shows total refunds increasing at a 1.2% CAGR during 2015-2019.
[caption id="attachment_103571" align="aligncenter" width="700"]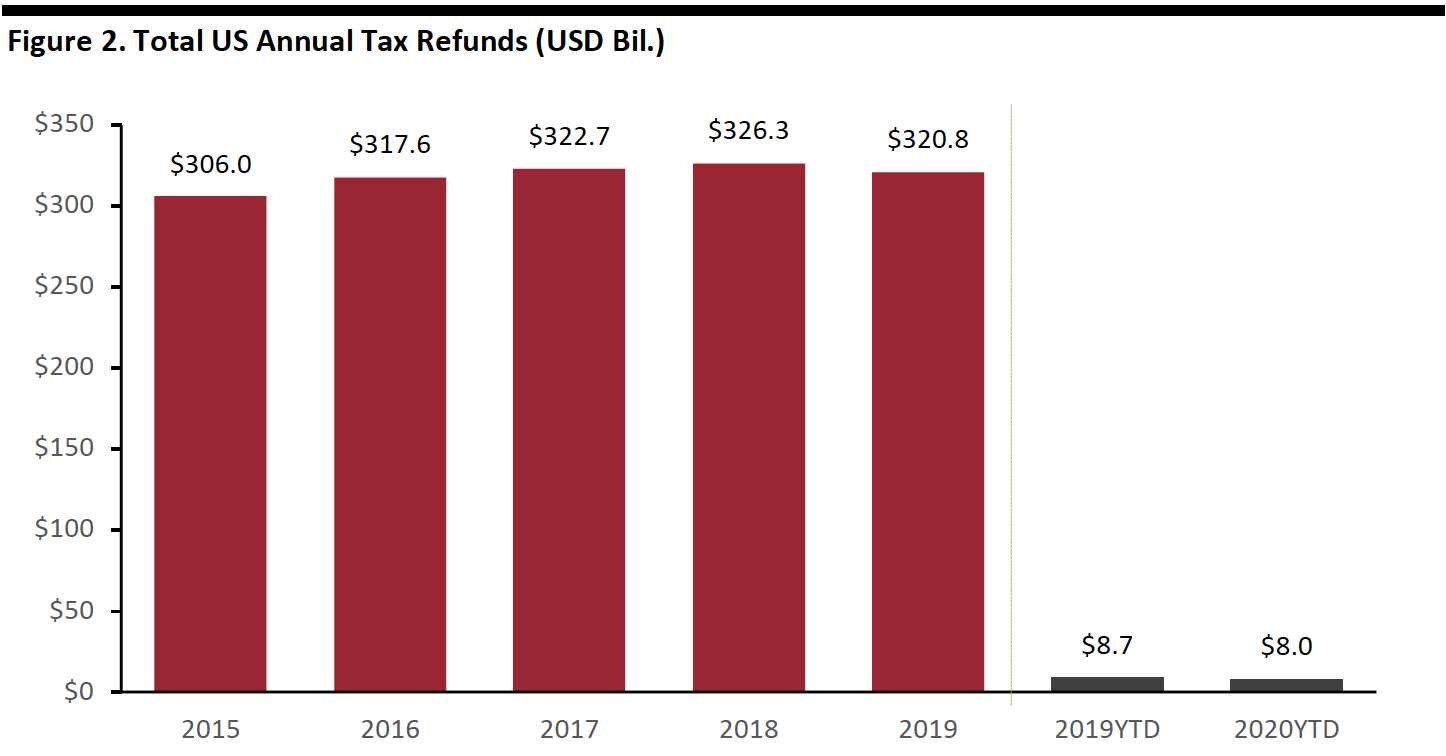 Source: IRS[/caption]
- Form 1040 will now include virtual currency questions. Taxpayers who engaged in a transaction involving virtual currency will need to file a Schedule 1, Additional Income and Adjustments to Income form.
- Taxpayers 65 years or older can use a new 1040-SR—a return form designed specifically for seniors.
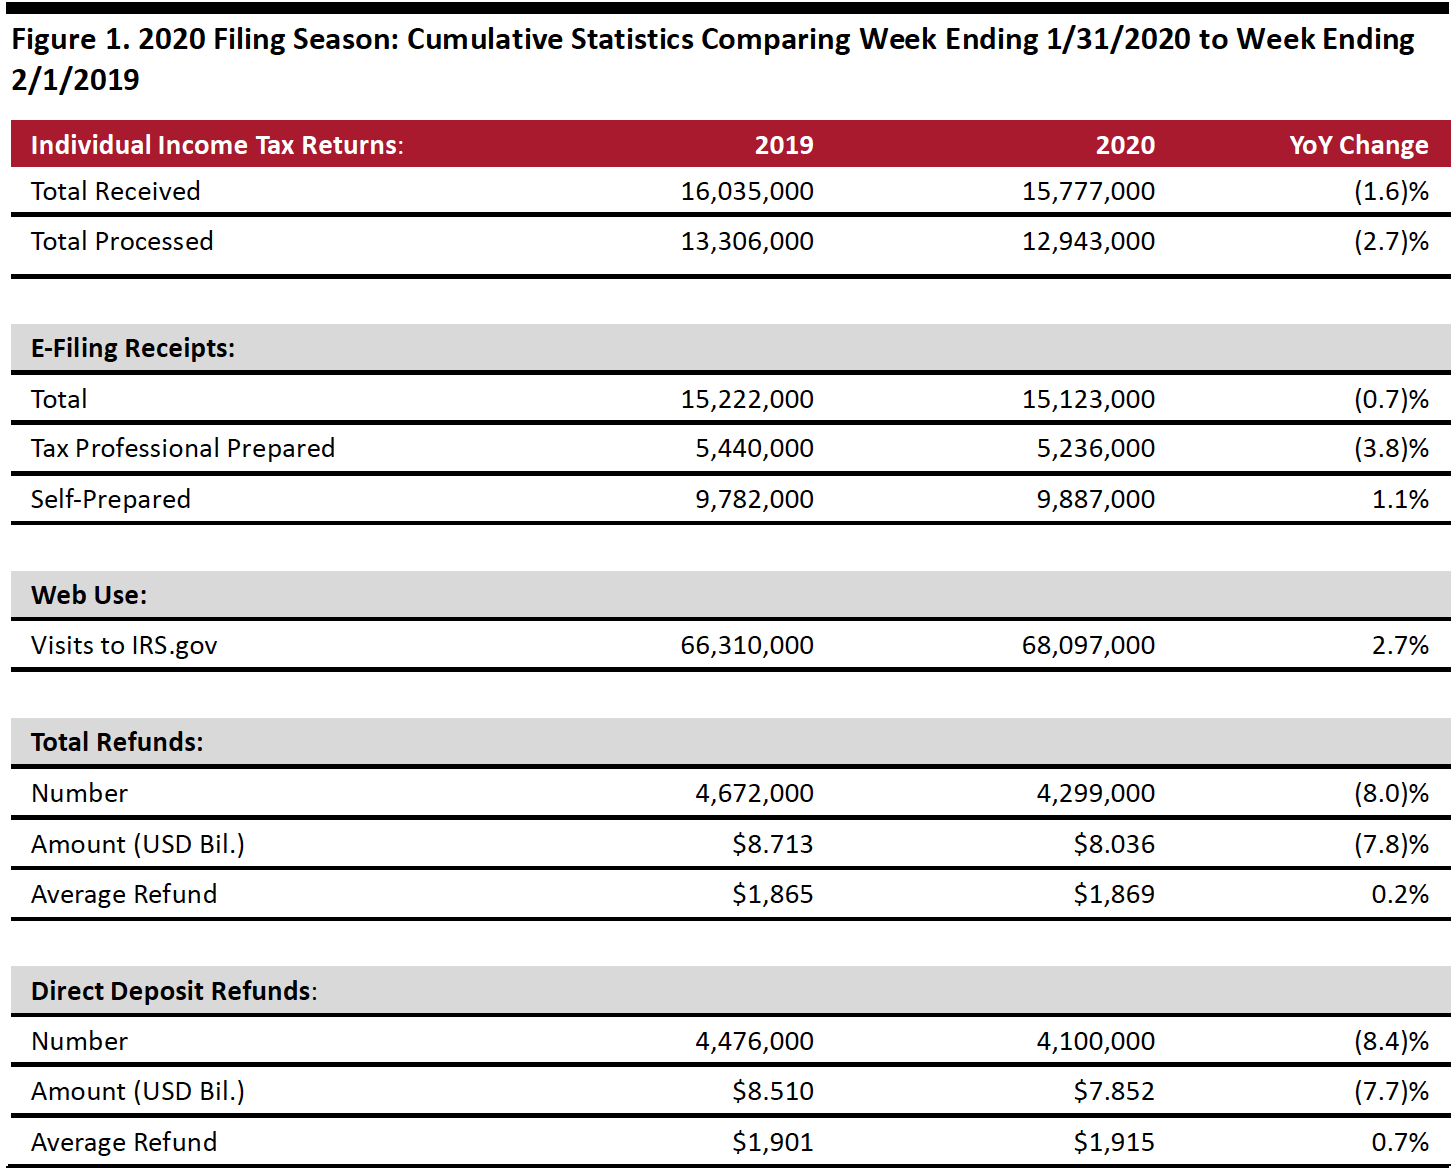
- The IRS had received 15.8 million tax returns and processed 12.9 million. The number of returns processed was down 2.7% year over year.
- The share of taxpayers filing electronically continues to increase steadily. Of the returns filed already, 95.9% were filed electronically, higher than the same period last year period. Of those, 34.6% were prepared by tax professionals, the remaining 65.4% were self-prepared.
- Slightly more people used the IRS website for information: The site logged about 68.1 million visits, up 2.7% year over year.
- A total of 4.3 million refunds had been issued as of January 31, totaling $8.04 billion and averaging $1,869 each. The number of refunds issued was down 8.0% and the total amount refunded was down 7.8% year-over-year. However, the average refund was up 0.2% year over year.
- Of those refunds issued, 95.8% were paid using direct deposit. The average direct deposit refund was $1,915, up 0.7% year over year.
Source: IRS[/caption]
The graph below shows total refunds increasing at a 1.2% CAGR during 2015-2019.
[caption id="attachment_103571" align="aligncenter" width="700"] Source: IRS[/caption]