Nitheesh NH
Each year, the IRS reports tax return filings and refunds on a weekly basis, starting in February and going until well after the April 15 filing deadline. Filings were likely delayed due to confusion over the new tax rates and the government shutdown, which made it difficult for accountants to get answers to help people prepare income tax returns. After the second week of returns data, the year-over-year decline in the number of filings moderated as tax filings caught up. However, only three days before the tax return filing deadline, returns, refunds and average value of returns are still slightly lower than in the same period last year.
As of April 5, 2019:
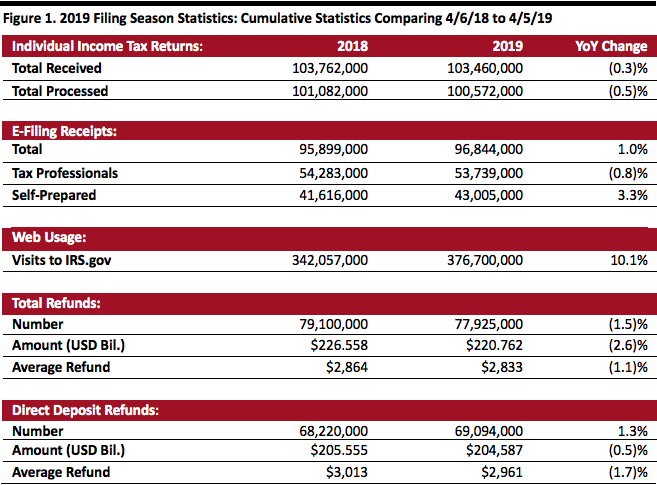 Source: IRS[/caption]
Given a solid US economy, higher wages and employment rates, in addition to a promised tax cut, total refunds should be higher in 2019, now that the disruption from the government shutdown has dissipated.
The graph below shows total annual refunds disbursed to consumers, which increased at a 1.5% CAGR during 2014-2018.
[caption id="attachment_84046" align="aligncenter" width="657"]
Source: IRS[/caption]
Given a solid US economy, higher wages and employment rates, in addition to a promised tax cut, total refunds should be higher in 2019, now that the disruption from the government shutdown has dissipated.
The graph below shows total annual refunds disbursed to consumers, which increased at a 1.5% CAGR during 2014-2018.
[caption id="attachment_84046" align="aligncenter" width="657"]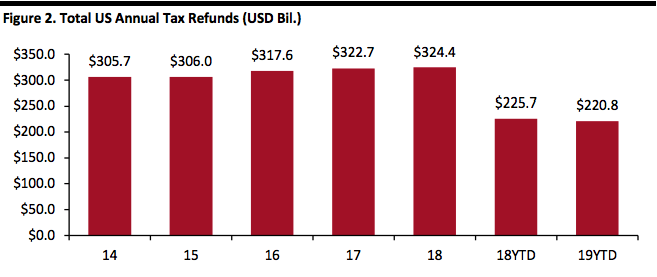 Source: IRS[/caption]
NRF Taxpayer Survey Highlights Savings, Debt Repayment and Everyday Expenses
The NRF has been conducting its annual Tax Returns Survey since 2007 and recently released its survey conducted in partnership with Prosper Insights & Analytics. In the survey, of 7,729 adults aged 18 and older, nearly two-thirds (65%) of those surveyed, expect to receive a refund. Of those expecting a refund:
Source: IRS[/caption]
NRF Taxpayer Survey Highlights Savings, Debt Repayment and Everyday Expenses
The NRF has been conducting its annual Tax Returns Survey since 2007 and recently released its survey conducted in partnership with Prosper Insights & Analytics. In the survey, of 7,729 adults aged 18 and older, nearly two-thirds (65%) of those surveyed, expect to receive a refund. Of those expecting a refund:
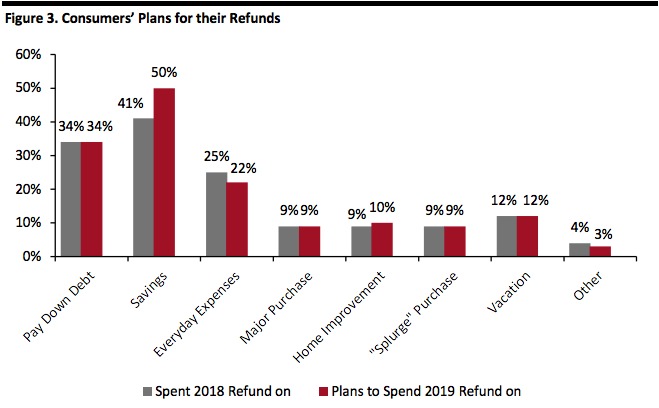 Source: NRF/Prosper Insights & Analytics[/caption]
- The IRS had received 103.5 million tax returns and processed 100.6 million. The number of returns received was down 0.3% from the corresponding date a year ago.
- Of the returns filed, 93.6% were electronically filed. Of those, 55.6% were prepared by tax professionals, the remaining 44.4% were self-prepared.
- More people are now using the IRS website to get information: The site logged about 376.7 million visits, up 10.1% from the year-ago period.
- A total of 77.9 million refunds had been issued as of April 5, totaling $220.8 billion and averaging $2,833 each, down $31 from a year ago. The number of refunds issued was down 1.5% and the total amount refunded is down 2.6% year-over-year, and the average refund is down 1.1%.
- Of those refunds issued, 88.7% were paid using direct deposit. The average direct deposit refund was $2,961, down 1.7% from the corresponding date last year.
Source: IRS[/caption]
Given a solid US economy, higher wages and employment rates, in addition to a promised tax cut, total refunds should be higher in 2019, now that the disruption from the government shutdown has dissipated.
The graph below shows total annual refunds disbursed to consumers, which increased at a 1.5% CAGR during 2014-2018.
[caption id="attachment_84046" align="aligncenter" width="657"] Source: IRS[/caption]
NRF Taxpayer Survey Highlights Savings, Debt Repayment and Everyday Expenses
The NRF has been conducting its annual Tax Returns Survey since 2007 and recently released its survey conducted in partnership with Prosper Insights & Analytics. In the survey, of 7,729 adults aged 18 and older, nearly two-thirds (65%) of those surveyed, expect to receive a refund. Of those expecting a refund:
- 22% expect the refund to be less than last year
- 48% expect it to be the same
- 29% expect it to be higher
Source: NRF/Prosper Insights & Analytics[/caption]