Nitheesh NH
Each year, the US Internal Revenue Service (IRS) reports tax return filings and refunds on a weekly basis, starting in February and going into the April 15 filing deadline. It is still early in the filing season, so there will likely be more variability to the data. Filings are likely delayed due to confusion over the new tax rates and the government shutdown, which made it difficult for accountants to get answers to help people prepare income tax returns. After the second week of returns data, the year-over-year decline in the number of filings has moderated, indicating that tax filings are catching up.
About 28 million refunds were delayed by a couple of weeks due to changes to laws regarding the Earned Income Tax Credit and the Child Tax Credit, which were greatly expanded in the 2017 tax reform, based on information from MarketWatch; however, these refunds started to be paid and are captured in the latest weekly data.
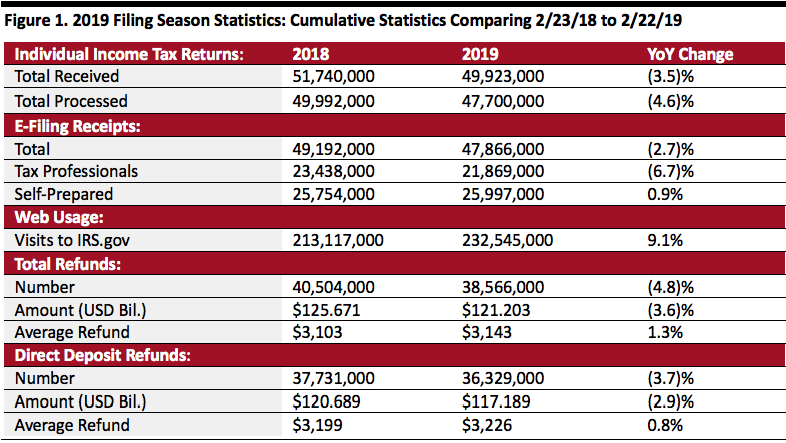
As of February 22, 2019:
 Source: IRS[/caption]
Given a solid US economy, higher wages and employment rates, total refunds are likely to be higher in 2019, once the disruption from the government shutdown is resolved.
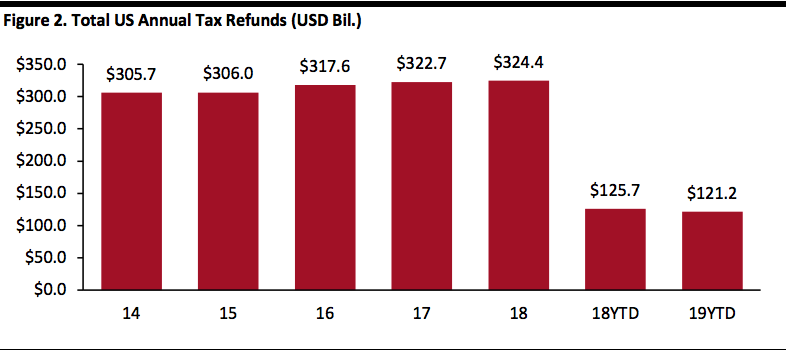
The graph below shows total annual refunds disbursed to consumers, which increased at a 1.5% CAGR during 2014–2018.
[caption id="attachment_79179" align="aligncenter" width="620"]
 Source: IRS[/caption]
- The IRS had received 49.9 million tax returns and processed 47.7 million of them. The number of returns received was down 3.5% from the corresponding date a year ago.
- Of the returns filed, 95.9% were electronically filed. Of those, 45.7% were prepared by tax professionals, the remaining 54.3% were self-prepared.
- More people are now using the IRS website to get information: the site logged about 232.5 million visits, up 9.1% from the year-ago period, reversing the previous decline.
- A total of 38.6 million refunds had been issued as of February 22, totaling $121.2 billion and averaging $3,143 each, up $40 from a year ago. The number of refunds issued was down 4.8% and the total amount refunded is down 3.6% year-over-year, and the average refund is up 1.3%.
- Of those refunds issued, 94.2% were paid using direct deposit. The average direct deposit refund was $3,226, up 0.8% from the corresponding date last year.
 Source: IRS[/caption]
Given a solid US economy, higher wages and employment rates, total refunds are likely to be higher in 2019, once the disruption from the government shutdown is resolved.
The graph below shows total annual refunds disbursed to consumers, which increased at a 1.5% CAGR during 2014–2018.
[caption id="attachment_79179" align="aligncenter" width="620"]
 Source: IRS[/caption]